Enhanced Web UI
The Enhanced Web UI, aside from all the features from the OSS version, also offers additional features and capabilities not available in the free version, making it a better option for those looking for more robust monitoring and management capabilities for their Karafka applications. Some of the key benefits of the Enhanced Web UI version include the following:
- Enhanced consumers utilization metrics providing much better insights into processes resources utilization.
- Consumer process inspection to quickly analyze the state of a given consuming process.
- Consumer jobs inspection to view currently running jobs on a per-process basis.
- Health dashboard containing general consumption overview information
- Data Explorer allowing for viewing and exploring the data produced to Kafka topics. It understands the routing table and can deserialize data before it is displayed.
- Enhanced error reporting allowing for backtrace inspection and providing multi-partition support.
- DLQ / Dead insights allowing to navigate through DLQ topics and messages that were dispatched to them.
- Consumer Processes Commanding from the Web interface.
Getting Started
Karafka Web UI will automatically switch to the Pro mode when Karafka Pro is in use.
There are no extra steps needed unless you want to completely disable consumers processes management.
Dashboard
The dashboard provides an all-encompassing insight into your Karafka operations. It’s an indispensable tool for anyone looking to monitor, optimize, and troubleshoot their Karafka processes. With its user-friendly interface and detailed metrics, you have everything you need to ensure the smooth running of your Kafka operations.
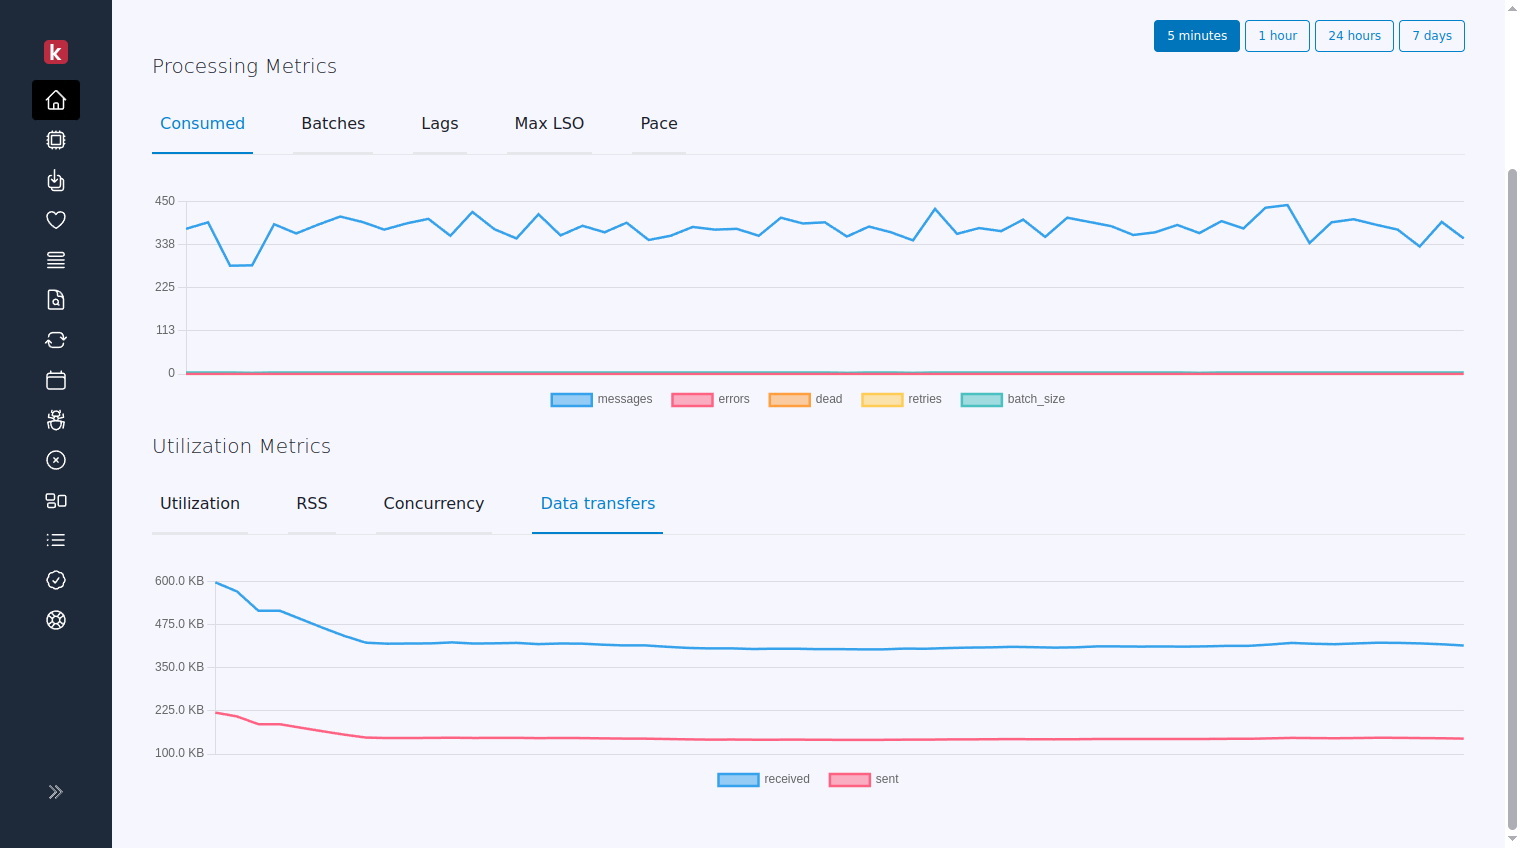
Consumers
Enhanced consumer view reports all of the metrics available in the OSS version but also reports:
- Machine memory usage
- Machine memory available
- Average CPU load from the last minute, 5 minutes, and 15 minutes
- Threads utilization from the last 60 seconds
Those metrics can allow you to identify bottlenecks (CPU vs. IO) in your Karafka consumers.
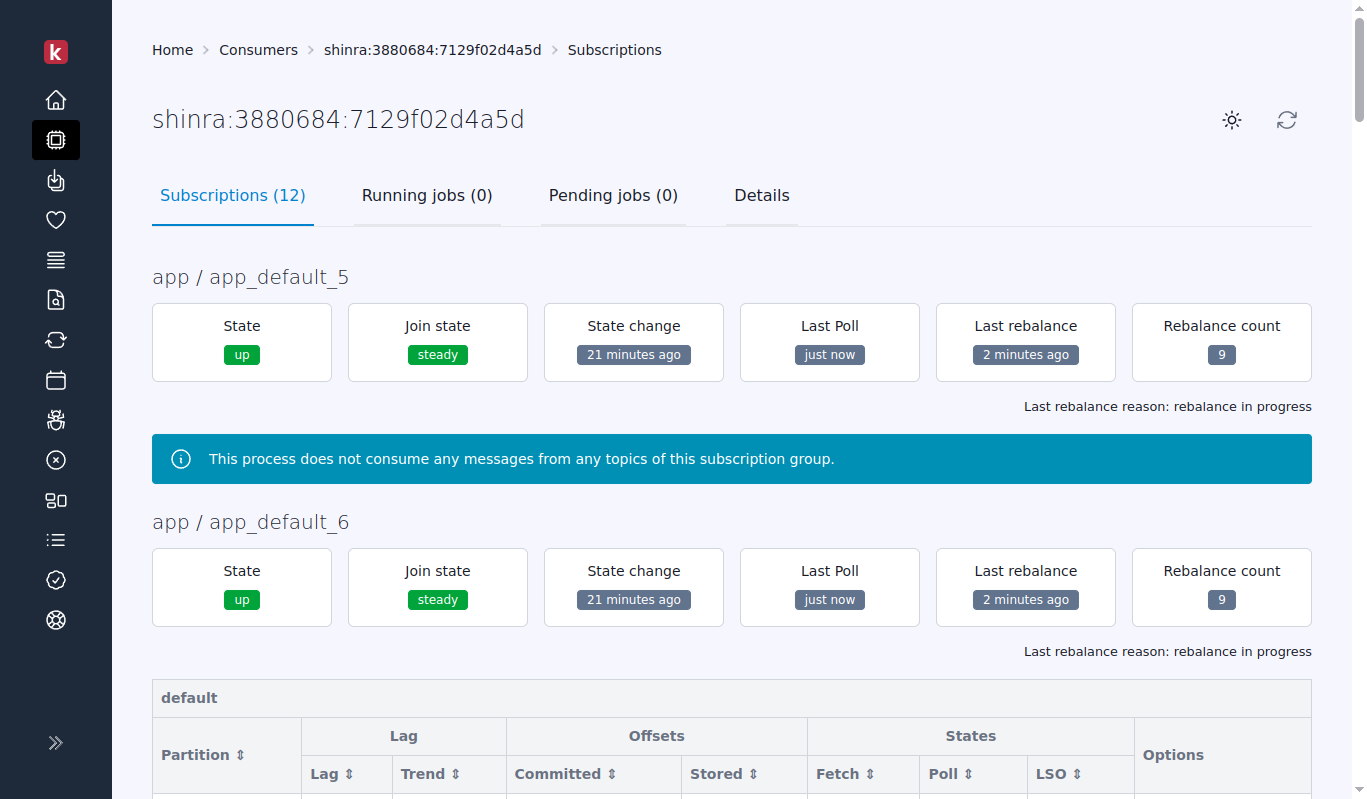
Consumer Process Inspection
Consumer process inspection view provides real-time visibility into the performance and behavior of a given consumer process and its Kafka subscriptions.
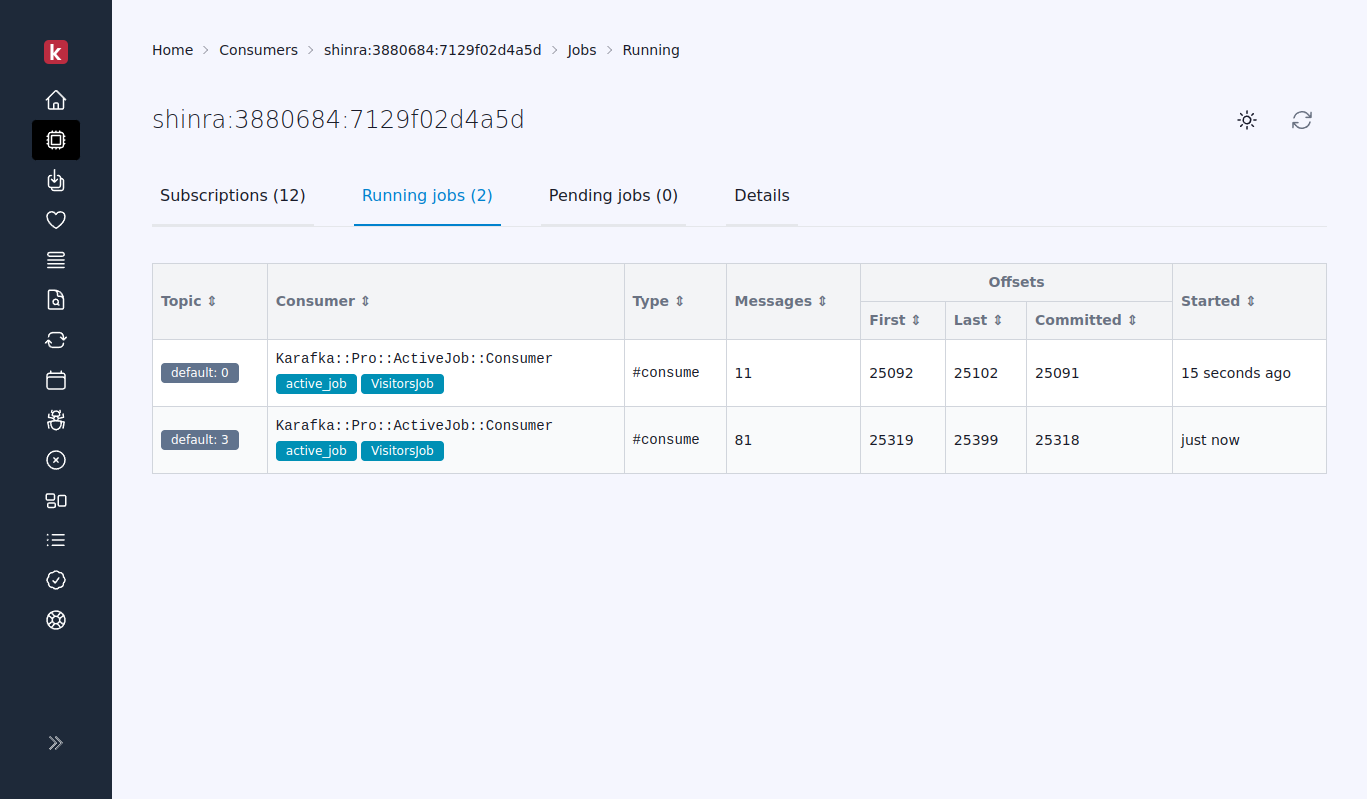
Consumer Jobs Inspection
The consumer jobs inspection view provides real-time visibility into the jobs running at the current moment on a given consumer instance.
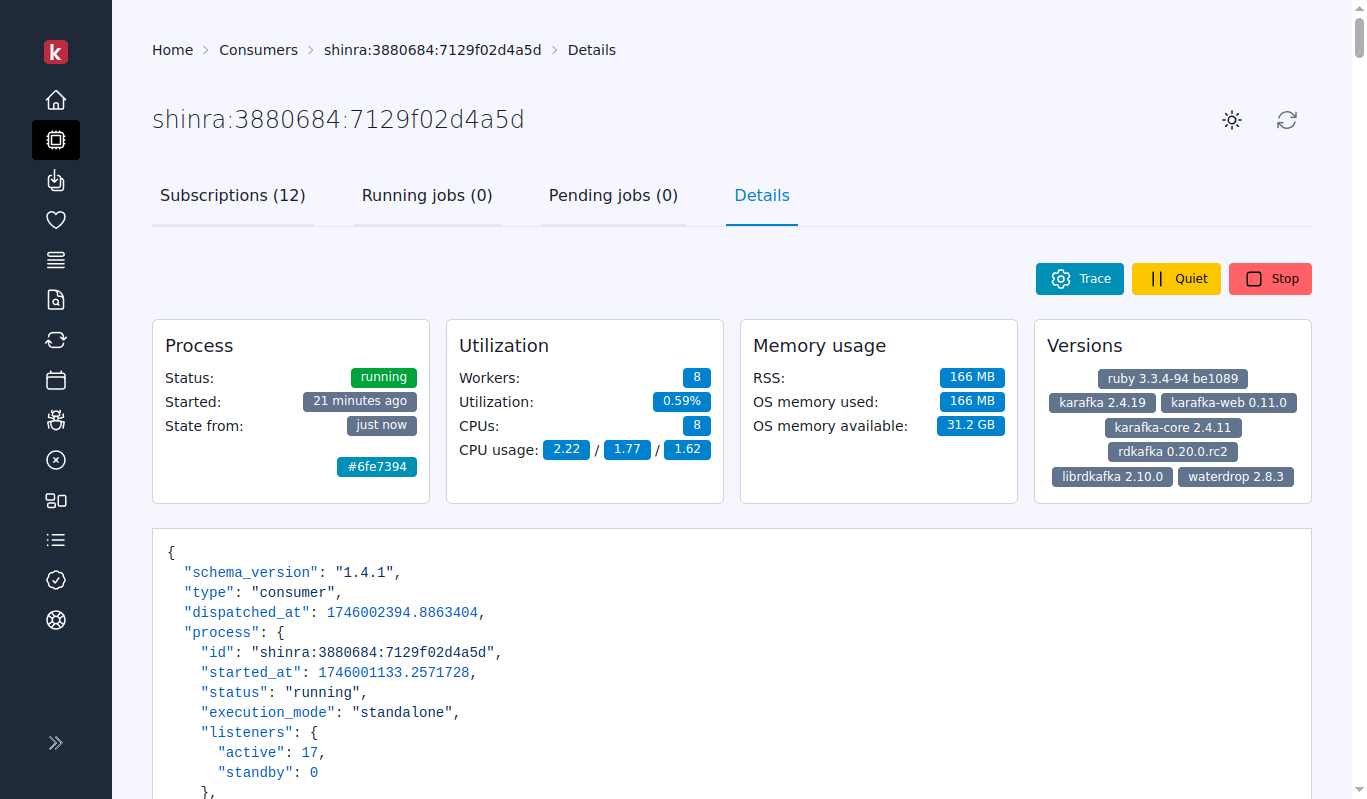
Consumer Details Inspection
This feature offers users a detailed look into each process's current state report. It's a valuable tool for thorough debugging and precise per-process inspection.
Commanding
This feature has its own dedicated documentation that you can access here.
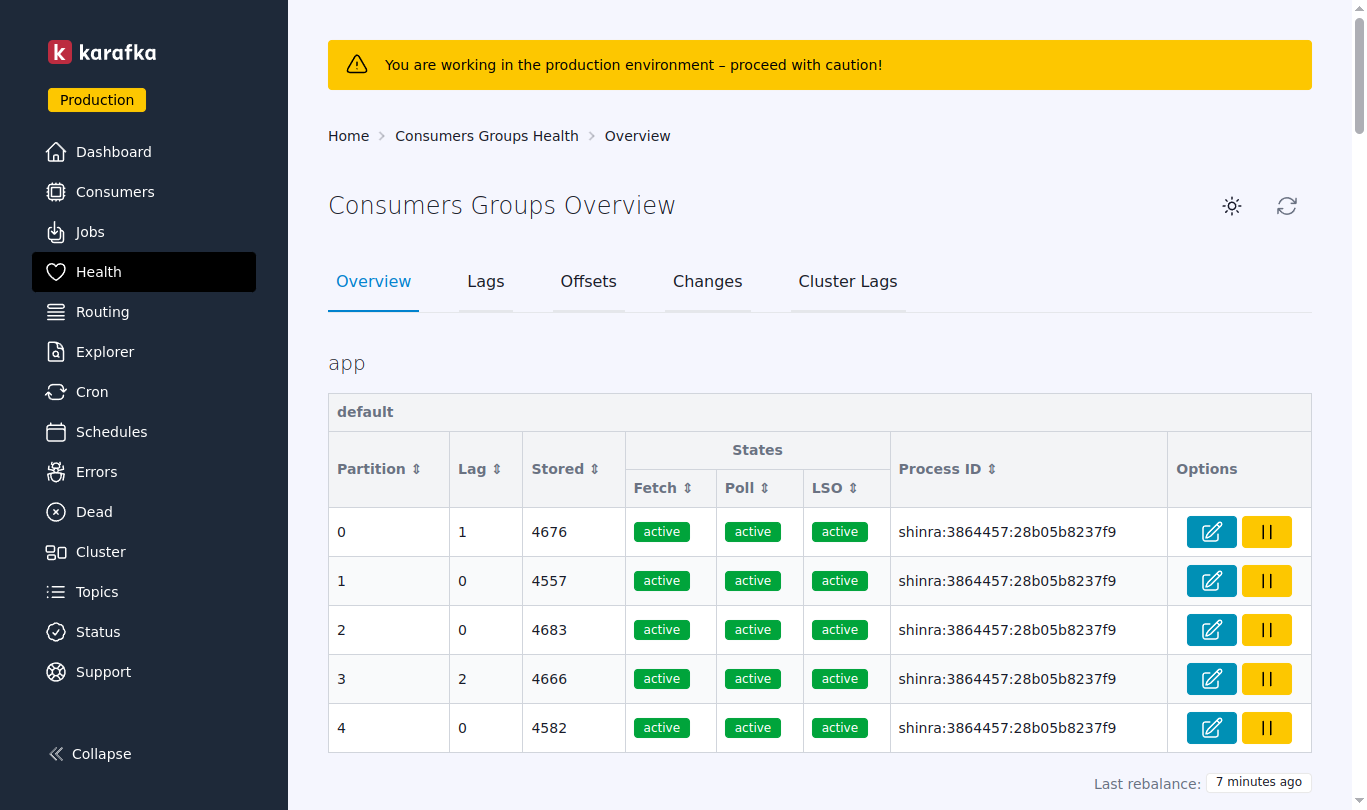
Health
This dashboard views show Karafka consumers' groups' health states with their lag aggregated information and basic trends.
Here you can learn more about the health information available in this dashboard view.
Topics Insights
The "Topics Insights" feature in Karafka Pro Web UI is a comprehensive suite designed to provide users with detailed information and analytics about their Kafka topics. This feature is crucial for developers who must ensure optimal configuration and performance of their Kafka topics. You can learn more about this feature here.
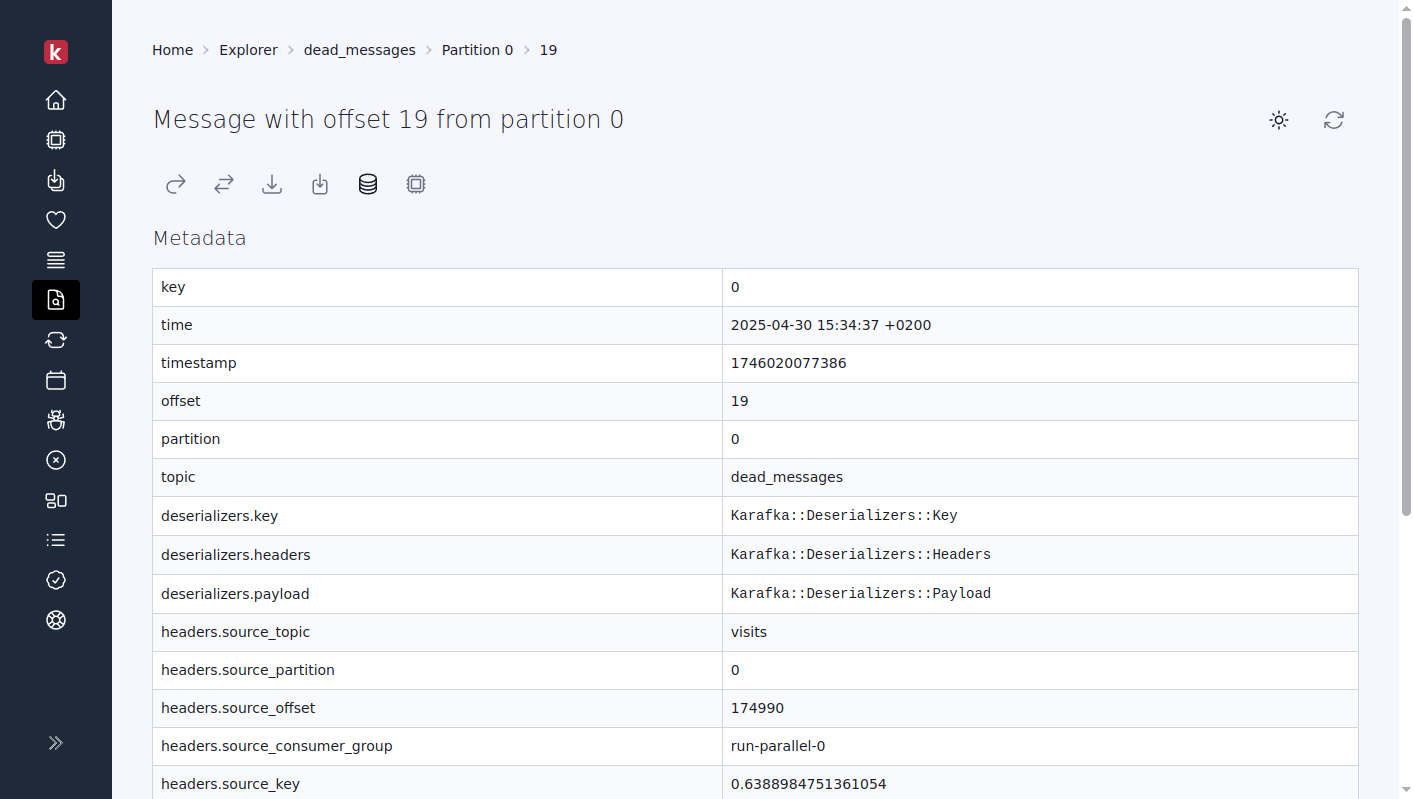
Explorer
The "Web UI Explorer" in Karafka Pro Web UI provides detailed insights and analytics about Kafka messages. Essential for developers, it helps monitor, debug, and optimize Kafka applications. Learn more here
Search
The Search feature is part of the Karafka Web UI Explorer, but due to its complexity, it has its dedicated section that can be found here.
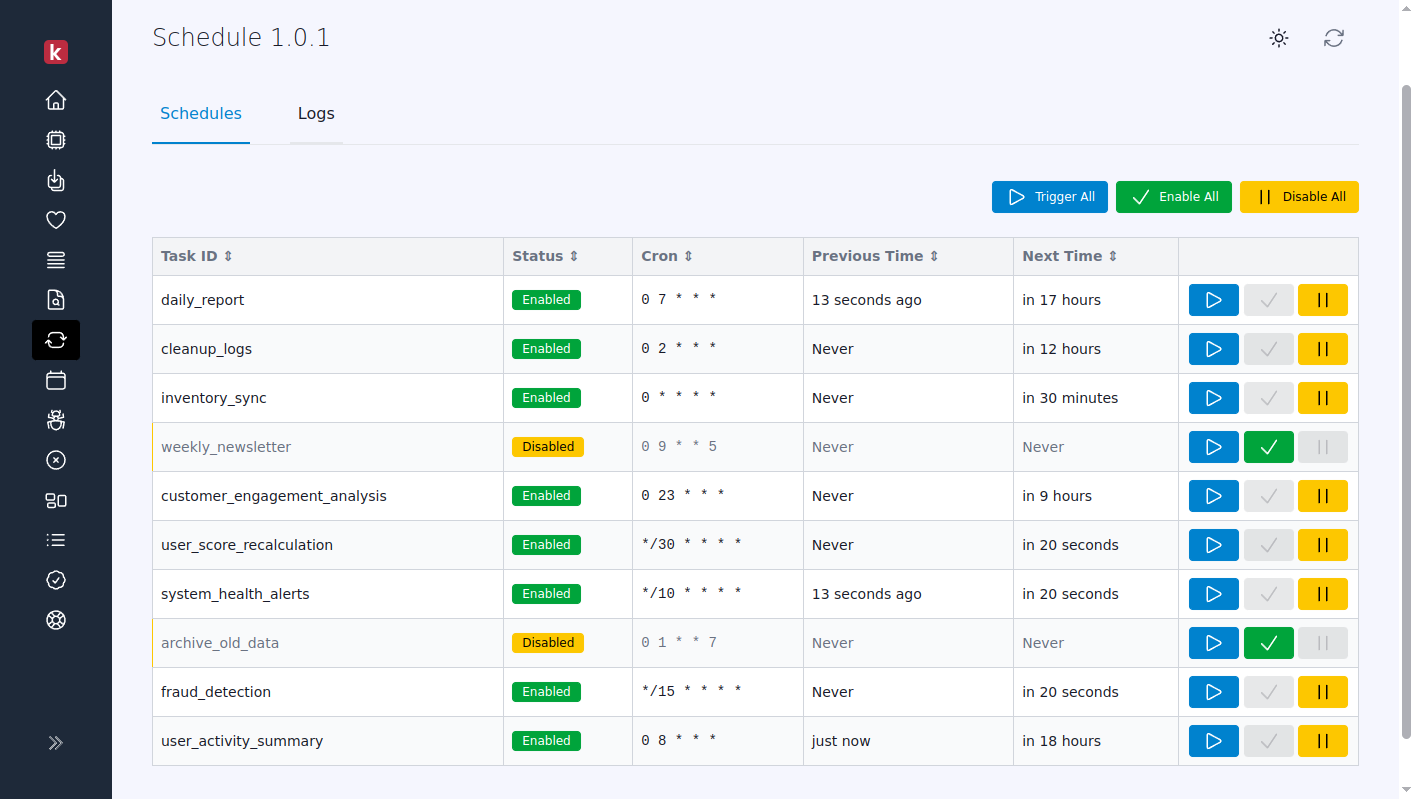
Recurring Tasks
In the Karafka Pro Web UI, you can manage and monitor recurring tasks with ease:
- Inspect Tasks: View detailed information on each task, including status, next execution, and last execution result.
- Control Tasks: Enable, disable, or trigger tasks directly from the UI.
- View Logs: Access and explore execution logs to track task performance and troubleshoot issues.
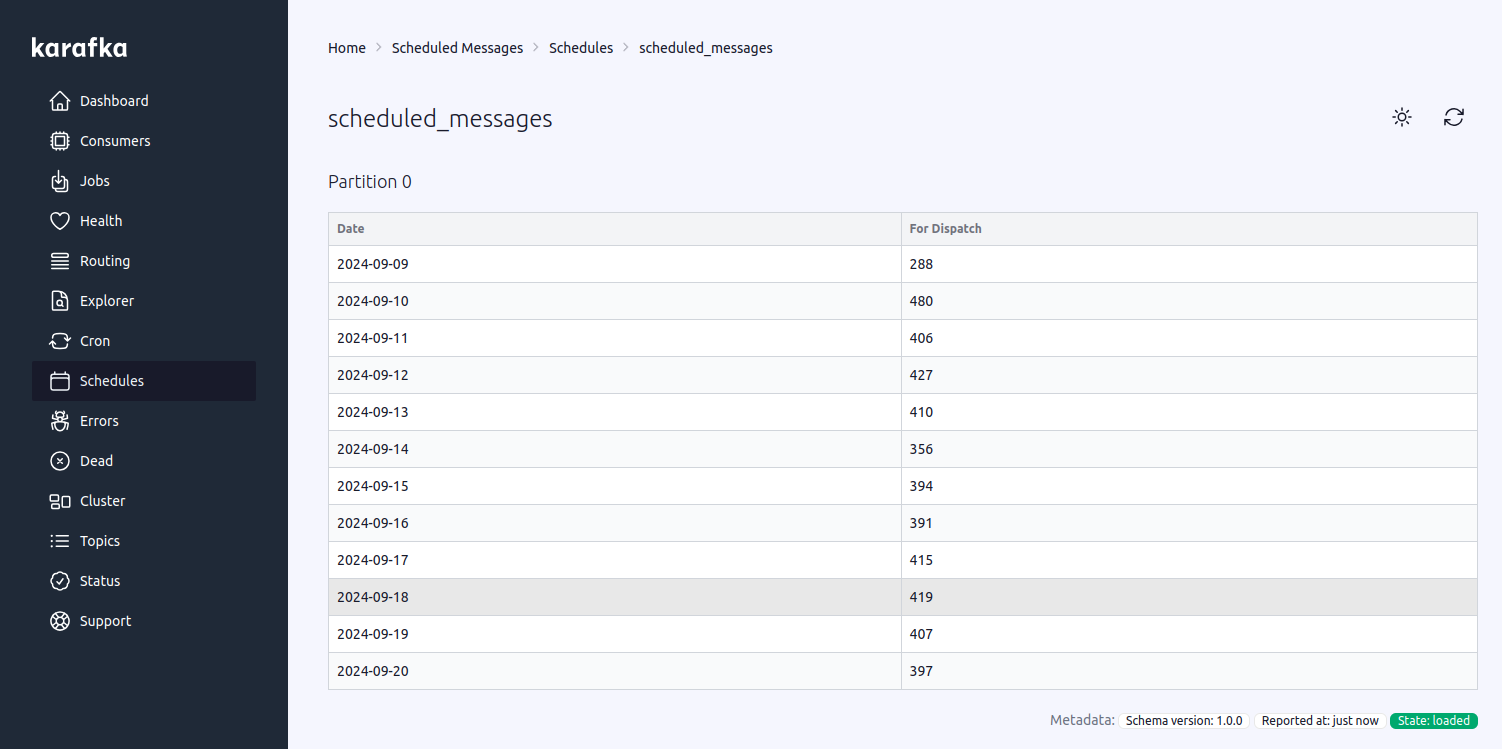
Scheduled Messages
Karafka Pro's Enhanced Web UI provides detailed insights into scheduled messages, enabling efficient management and monitoring:
- Daily Dispatch Estimates: View estimates of messages scheduled for dispatch across partitions, aiding in operational planning.
- Loading State Monitoring: Monitor the loading state of partitions to ensure readiness, especially after nightly reloads.
- Message Exploration: Access detailed information about messages, queued for future dispatch, including scheduled times and payload details.
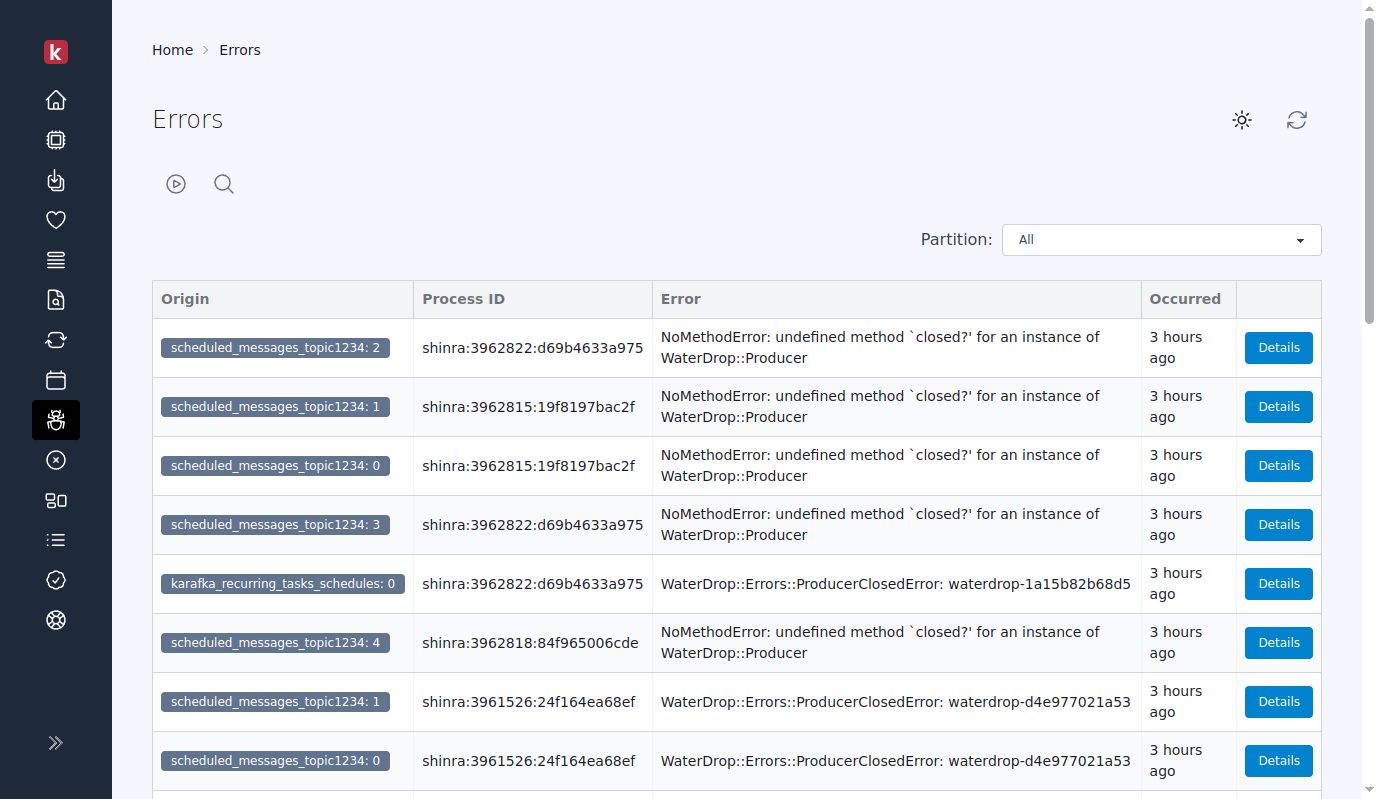
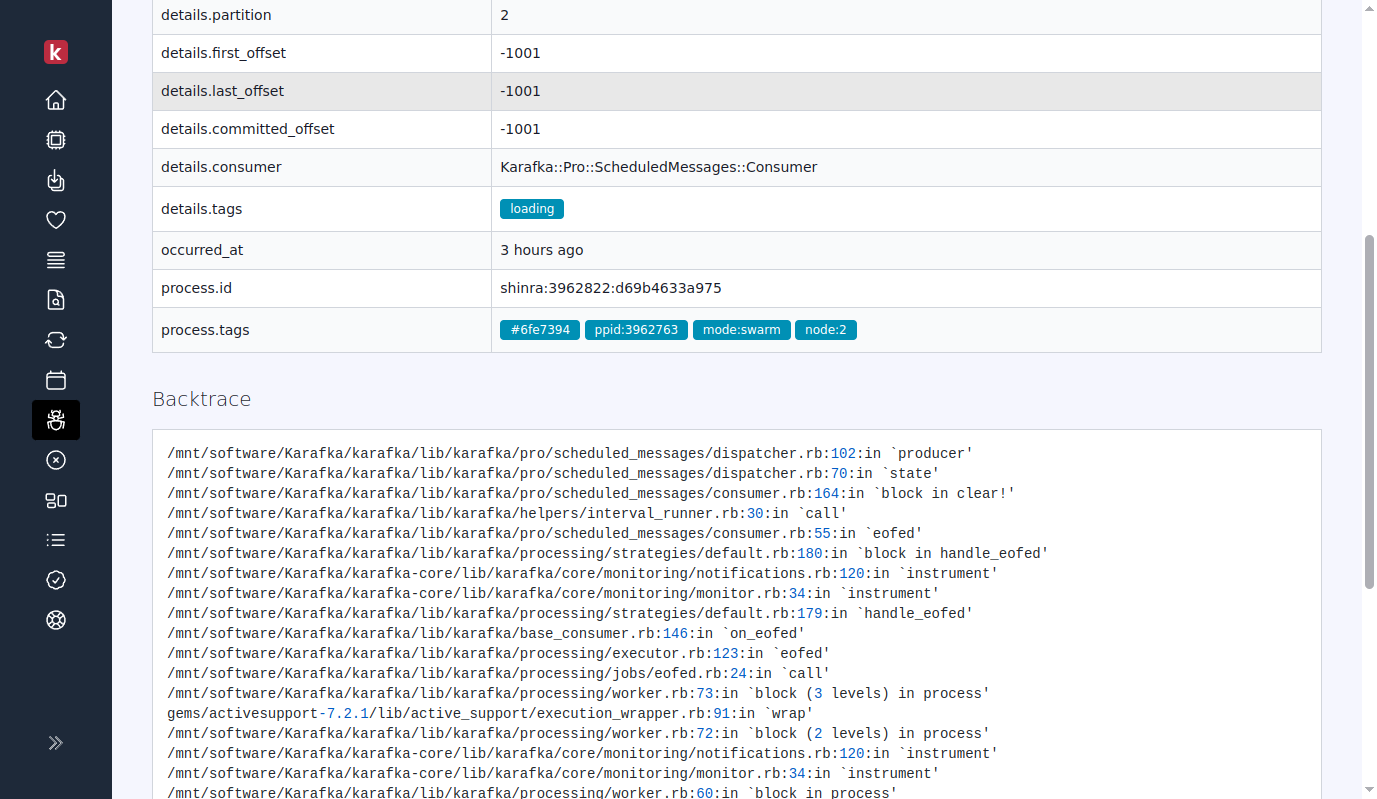
Errors
Enhanced Web UI errors provide a few enhancements:
- Supports error tracking on a high-scale due to the support of multiple partitions for the error topic.
- Supports errors backtrace reporting in the dashboard.
It allows for easier debuggability and error exploration, enabling users to perform real-time data analysis and troubleshoot issues faster.
Errors list:
Error details:
DLQ / Dead
Dead insights allowing to navigate through DLQ topics and messages that were dispatched to them.
Automatic Qualification of DLQ Topics
Web UI will automatically classify any topics that contain dlq or dead_letter in their names - irrespective of case - as Dead Letter Queue (DLQ) topics. This means topics labeled with variations such as DLQ, dlq, Dead_Letter, or DEAD_LETTER will be viewed and managed under the DLQ view.
DLQ dispatched messages view:

DLQ dispatched per message view:
Branding
This feature allows you to set an environment-specific notice and a menu label to distinguish between different environments like production, development, and staging. This helps prevent confusion and mistakes when managing various environments.
This feature has its own dedicated documentation that you can access here.
Policies
Karafka's Web UI includes a comprehensive policies engine that provides granular control over user actions across all UI components. This engine allows administrators to define and enforce policies on what specific users can view and do within the Web UI, ensuring compliance with data protection and privacy standards.
This feature has its own dedicated documentation that you can access here.
Custom Styling
Web UI supports the ability to customize the appearance and behavior of the interface through custom CSS and JavaScript. This feature allows you to adapt the Web UI to match your organization's branding, enhance usability for specific use cases, or add visual indicators for different environments.
Custom styling can be configured using two settings in the Web UI configuration:
Karafka::Web.setup do |config|
  # Custom CSS configuration
  config.ui.custom_css = '/path/to/your/custom.css'
  # or inline CSS
  config.ui.custom_css = '.dashboard { background-color: #f5f5f5; }'

  # Custom JavaScript configuration
  config.ui.custom_js = '/path/to/your/custom.js'
  # or inline JavaScript
  config.ui.custom_js = 'document.addEventListener("DOMContentLoaded", () => { console.log("JS loaded"); });'
end
Both custom_css and custom_js settings accept either:
- A file path to a CSS or JavaScript file
- A string containing inline CSS or JavaScript code
falseto disable custom styling (default)
CSS Targeting by Controller and Action
To facilitate more granular styling, the Web UI automatically adds special CSS classes to the <body> element:
.controller-NAME- Contains the current controller name (e.g.,controller-dashboard).action-NAME- Contains the current action name (e.g.,action-index)
These classes allow you to target specific pages or views with your custom CSS:
/* Style only the dashboard page */
body.controller-dashboard {
  background-color: #f8f9fa;
}

/* Style a specific action within a controller */
body.controller-consumers.action-show .stats-card {
  border-left: 4px solid #28a745;
}

/* Style error pages differently */
body.controller-errors {
  background-color: #fff8f8;
}
Compatibility Notes
- Custom CSS and JavaScript are loaded after the default styles and scripts
- The custom styling feature respects the Web UI's dark mode settings
- Custom assets are properly cached by the browser for optimal performance
- Custom styling is applied to all pages, including error pages
When used in combination with the Branding feature, custom styling provides a comprehensive way to tailor the Karafka Web UI to your organization's needs.
Topics Management
The "Topics Management" feature in Karafka Web UI allows you to create, delete, configure, and manage Kafka topics directly from the web interface without command-line tools. You can create topics with custom settings, safely remove unused topics, adjust configurations, and scale throughput by increasing partition counts.
This feature has dedicated documentation that you can access here.
Last modified: 2025-05-01 16:51:26