 ## Web UI Features / Consumers
!!! info "Enhanced Consumer Metrics in Pro"
More metrics and detailed consumers inspection are available only in our Pro offering.
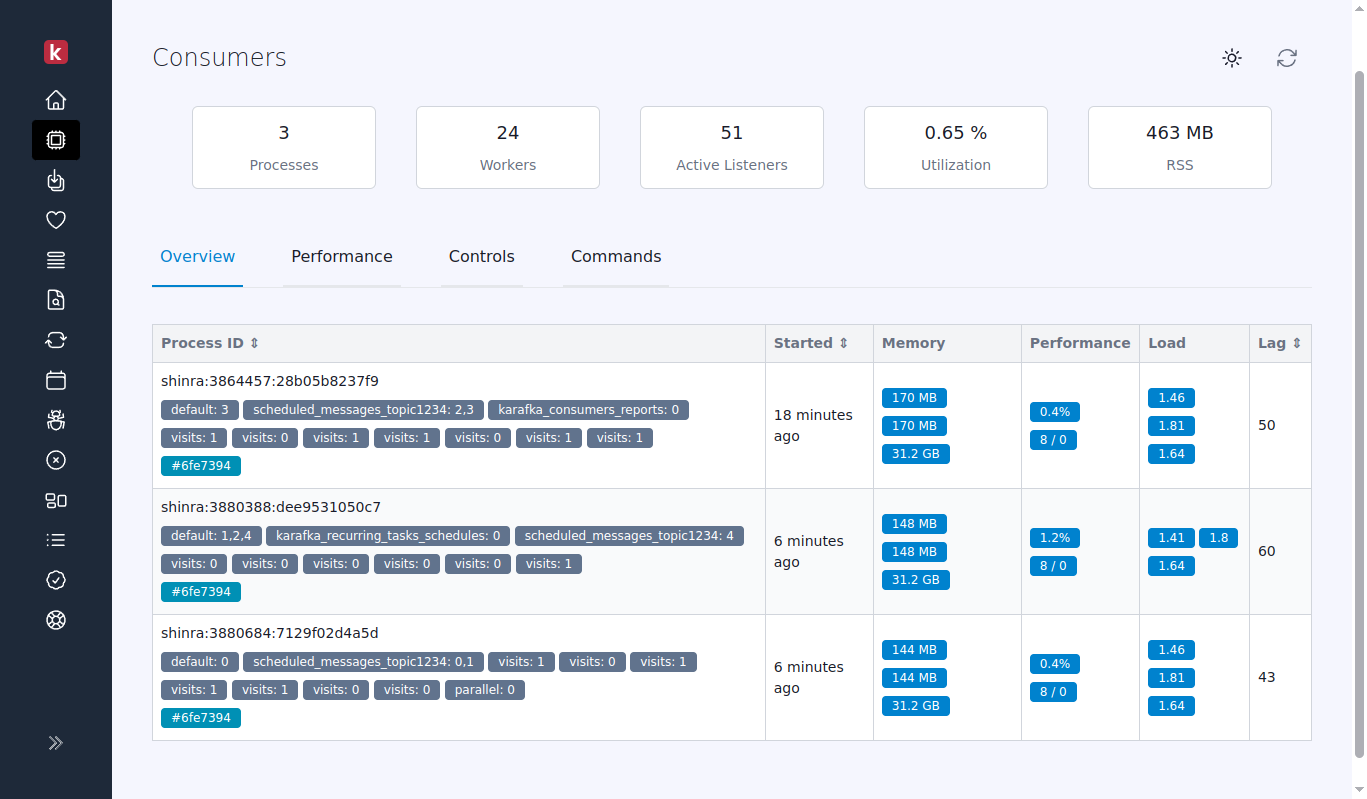
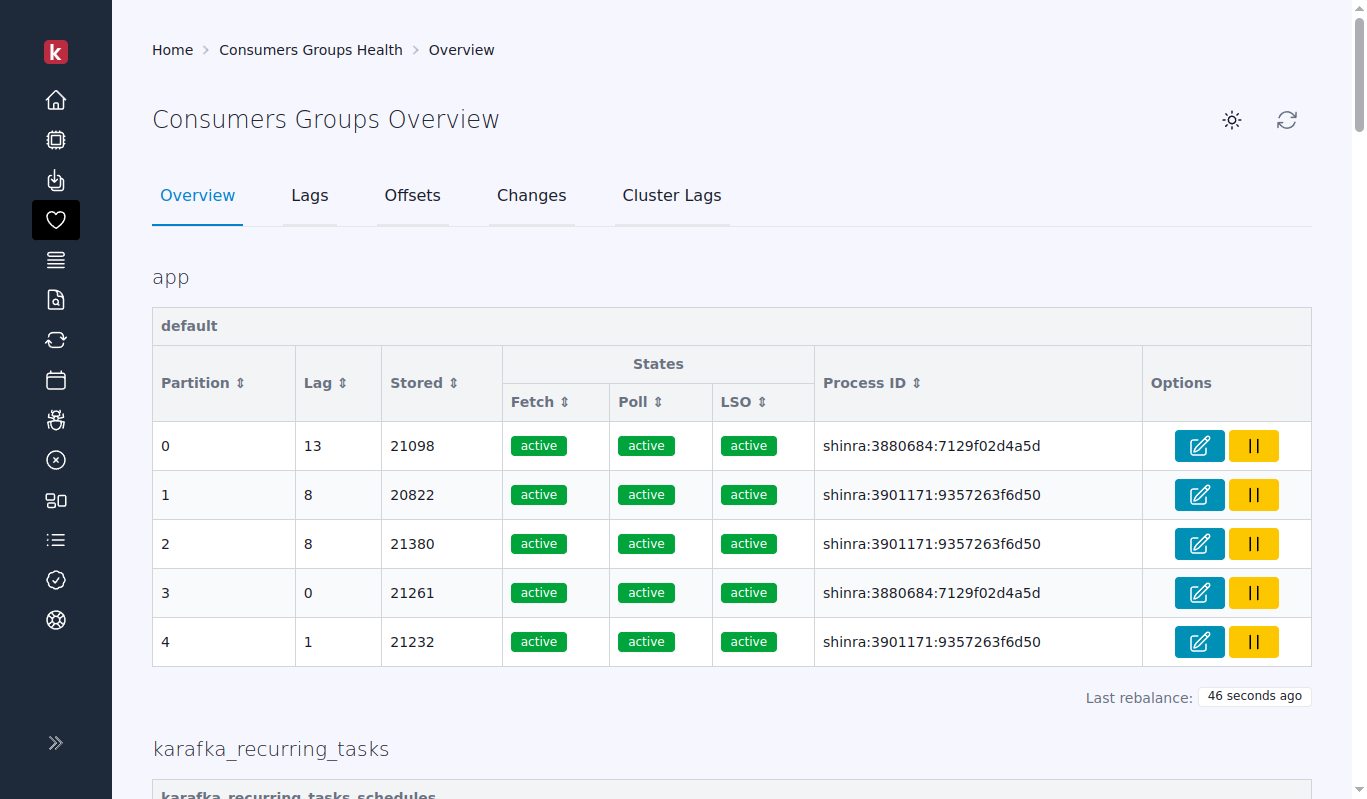
The consumers status view allows users to view and monitor the performance of Kafka-running consumers. The page displays real-time data and aggregated metrics about the status of the consumers, such as their current offset, lag, the current state of consumers, and others.
## Web UI Features / Consumers
!!! info "Enhanced Consumer Metrics in Pro"
More metrics and detailed consumers inspection are available only in our Pro offering.
The consumers status view allows users to view and monitor the performance of Kafka-running consumers. The page displays real-time data and aggregated metrics about the status of the consumers, such as their current offset, lag, the current state of consumers, and others.
| State | Meaning |
|---|---|
init |
Consumer has just started. No group join has been attempted yet. |
wait-join |
JoinGroup request sent to the broker; awaiting the broker's response. |
wait-metadata |
Waiting for a cluster metadata refresh before (re)joining the group. This state is only entered during a proper join or rejoin, not routine metadata updates. |
wait-sync |
SyncGroup request sent to the broker (follower path); awaiting the group leader's partition assignment. |
wait-assn |
Waiting for the partition assignment to be delivered. Appears in older librdkafka versions. |
wait-assign-call |
Assignment received from the broker; waiting for the application's assign callback to complete before consumption can begin. |
wait-unassign-call |
Waiting for the application's revoke callback to complete before partitions are surrendered. |
wait-unassign-to-complete |
Revoke callback finished; waiting for the full partition unassignment to be processed internally. Occurs during eager (non-cooperative) rebalances. |
wait-incr-unassign-to-complete |
Waiting for a partial (incremental) partition unassignment to finish. Occurs during cooperative rebalances where only a subset of partitions is being revoked. |
steady |
Consumer is synchronized and fully assigned. This is the normal healthy operating state. The assignment may be empty if no partitions were allocated to this consumer instance. |
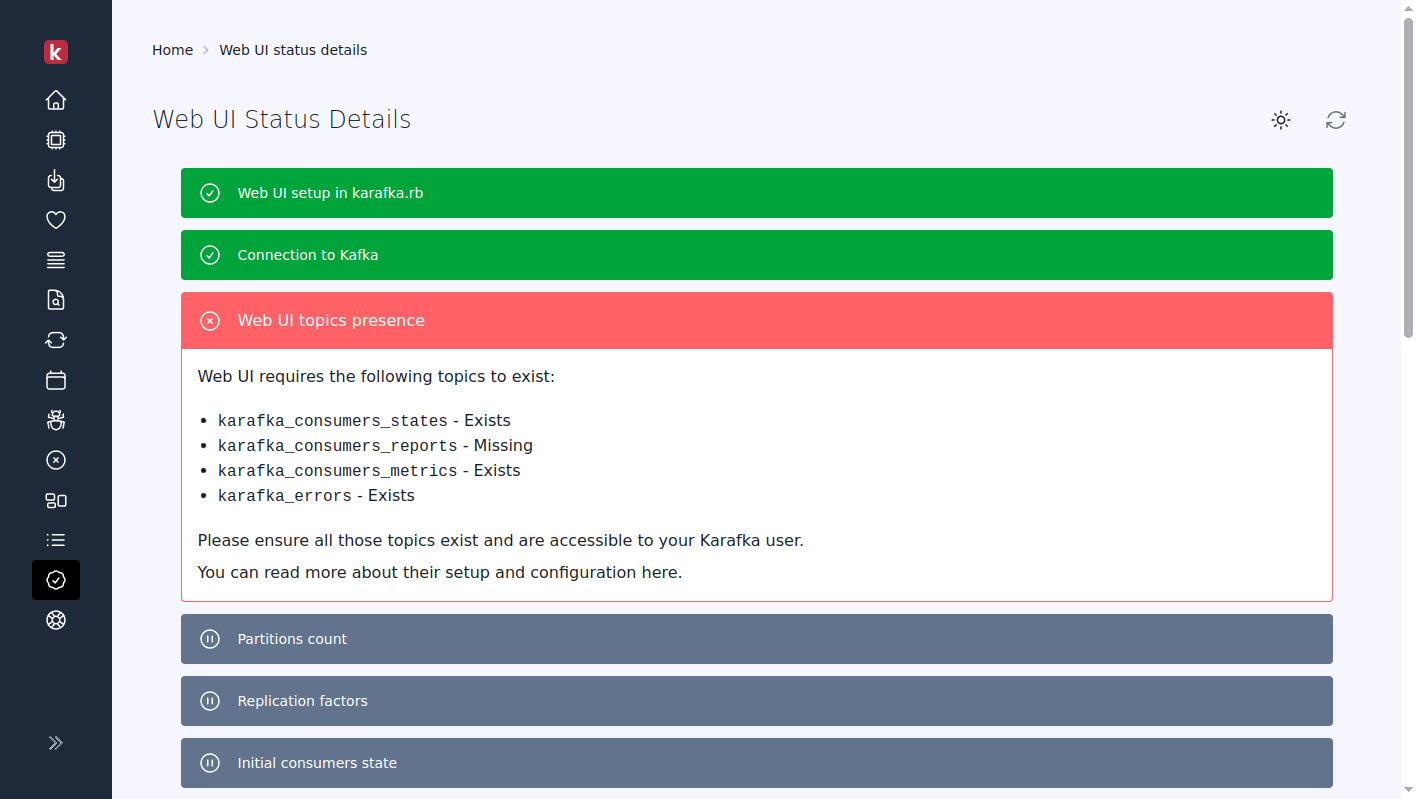
| Check Status | Description |
|---|---|
| Success | All is good, and the given check has passed. |
| Failure | Check has failed. Additional information should be provided to explain the nature of the issue. |
| Halted | Check was not executed due to a previous check failing. This status does not necessarily mean that a specific process was halted but rather that the check could not be performed because a prior check failed. |
| Info | Informative message that does not perform any checks but provides relevant details. |