Monitoring and Logging
Karafka uses a simple monitor with an API compatible with dry-monitor and ActiveSupport::Notifications to which you can easily hook up with your listeners. You can use it to develop your monitoring and logging systems (for example, NewRelic) or perform additional operations during certain phases of the Karafka framework lifecycle.
The only thing hooked up to this monitoring is the Karafka logger listener (Karafka::Instrumentation::LoggerListener). It is based on a standard Ruby logger or Ruby on Rails logger when used with Rails. You can find it in your karafka.rb file:
Karafka.monitor.subscribe(Karafka::Instrumentation::LoggerListener.new)
If you are looking for examples of implementing your listeners, here, you can take a look at the default Karafka logger listener implementation.
The only thing you need to be aware of when developing your listeners is that the internals of the payload may differ depending on the instrumentation place.
A complete list of the supported events can be found here.
Handle Instrumentation Listener Errors Carefully
Instrumentation listeners in Karafka must not generate errors as they can cause severe disruptions, including forcing the framework into a recovery mode or even shutting down processes. Errors within worker threads can lead to improper message acknowledgment, resulting in message loss or duplication. Always thoroughly test your instrumentation code and incorporate robust internal error handling to prevent any impact on the stability and functionality of your Karafka application.
Subscribing to the instrumentation events
The best place to hook your listener is at the end of the karafka.rb file. This will guarantee that your custom listener will be already loaded into memory and visible for the Karafka framework.
You should set up listeners after configuring the app because Karafka sets up its internal components right after the configuration block. That way, we can be sure everything is loaded and initialized correctly.
Subscribing with a listener class/module
Karafka.monitor.subscribe(MyAirbrakeListener.new)
Subscribing with a block
Karafka.monitor.subscribe 'error.occurred' do |event|
  type = event[:type]
  error = event[:error]
  details = (error.backtrace || []).join("\n")

  puts "Oh no! An error: #{error} of type: #{type} occurred!"
  puts details
end
Using the app.initialized event to initialize additional Karafka framework settings dependent libraries
Lifecycle events can be used in various situations, for example, to configure external software or run additional one-time commands before messages receiving flow starts.
# Once everything is loaded and done, assign the Karafka app logger as a Sidekiq logger
# @note This example does not use config details, but you can use all the config values
#   via Karafka::App.config method to setup your external components
Karafka.monitor.subscribe('app.initialized') do |_event|
  Sidekiq::Logging.logger = Karafka::App.logger
end
Using the Karafka.monitor for application specific events
Karafka.monitor can be used for monitoring Karafka's internal events and for instrumenting and observing custom, application-specific events. Allowing developers to register and monitor their own events provides a unified way to instrument Karafka and custom business operations within Karafka.
Registering and Instrumenting Custom Events
To register your custom event with the Karafka monitor, you can use the #register_event method:
# Register the event
Karafka.monitor.notifications_bus.register_event('app.custom.event')
After registering an event, you can instrument with it as follows:
Karafka.monitor.instrument('app.custom.event') do
  puts 'This is my instrumented custom logic!'
end
You can subscribe to those events the same way as you subscribe to the internal Karafka events:
# Via a block:
Karafka.monitor.subscribe('app.custom.event') do |event|
  puts "Custom logic was executed. Details: #{event}"
end

# Or by using a listener with `#on_app_custom_event` method:
Karafka.monitor.subscribe(AppEventsListener.new)
Use Cases for Custom Events
Here are some examples where instrumenting custom events can be beneficial:
-
Performance Monitoring: If your application has a particular business operation or function that you suspect might be a performance bottleneck, you can instrument it and measure its execution time.
-
External Service Calls: If your application interacts with external APIs or services, you can instrument events to monitor the success, failure, and response time of these external calls.
-
Data Flow Monitoring: In data-intensive applications, you can instrument events to monitor data flow as it's ingested, processed, transformed, or exported.
Naming Considerations for Custom Events
Ensuring that your custom events' names don't clash with Karafka's internal events is essential. As a best practice, consider prefixing your event names with a unique identifier like app. or any other prefix that distinguishes your events from Karafka's. This approach prevents naming conflicts and provides clarity when observing and debugging events.
For example, a custom event to monitor external API calls could be named app.external_api_call:
Karafka.monitor.notifications_bus.register_event('app.external_api_call')
Usage Statistics and Subscribing to statistics.emitted Event
Always keep statistics.emitted handlers concise and non-blocking
When subscribing to statistics.emitted, ensure your code is concise and non-blocking, as this runs every 5 seconds and during active processing. Long-running handlers can impede the polling process, affecting message consumption. Rigorously test your handlers - failures in processing these statistics can lead to critical exceptions that disrupt your consumption process.
Karafka emits metrics every 5 seconds by default, governed by the Kafka setting statistics.interval.ms. Metrics are also published during processing and long polling. Whether you are processing data or waiting on more information being shipped from Kafka, metrics publishing will occur.
Karafka may be configured to emit internal metrics at a fixed interval by setting the kafka statistics.interval.ms configuration property to a value > 0. Once that is done, emitted statistics are available after subscribing to the statistics.emitted publisher event. By default this setting is set to 5 seconds.
The statistics include all of the metrics from librdkafka (full list here) as well as the diff of those against the previously emitted values.
For several attributes like rxmsgs, librdkafka publishes only the totals. In order to make it easier to track the progress (for example number of messages received between statistics emitted events) and state changes, Karafka compares all the numeric values against previously available numbers enriching the original payload with following values:
METRIC_KEY_d- delta computed as a difference between current and previous value - useful for trends.METRIC_KEY_fd- freeze duration. Informs how long (in milliseconds) the given metric did not change - helpful for staleness detection.
class KarafkaApp < Karafka::App
  setup do |config|
    config.kafka = {
      'bootstrap.servers': 'localhost:9092',
      # Emit statistics every second
      'statistics.interval.ms': 1_000
    }
  end
end

Karafka::App.monitor.subscribe('statistics.emitted') do |event|
  sum = event[:statistics]['rxmsgs']
  diff = event[:statistics]['rxmsgs_d']

  p "Received messages: #{sum}"
  p "Messages received from last statistics report: #{diff}"
end
Web UI monitoring and error tracking
Karafka Web UI is a user interface for the Karafka framework. The Web UI provides a convenient way for developers to monitor and manage their Karafka-based applications, without the need to use the command line or third party software. It does not require any additional database beyond Kafka itself.
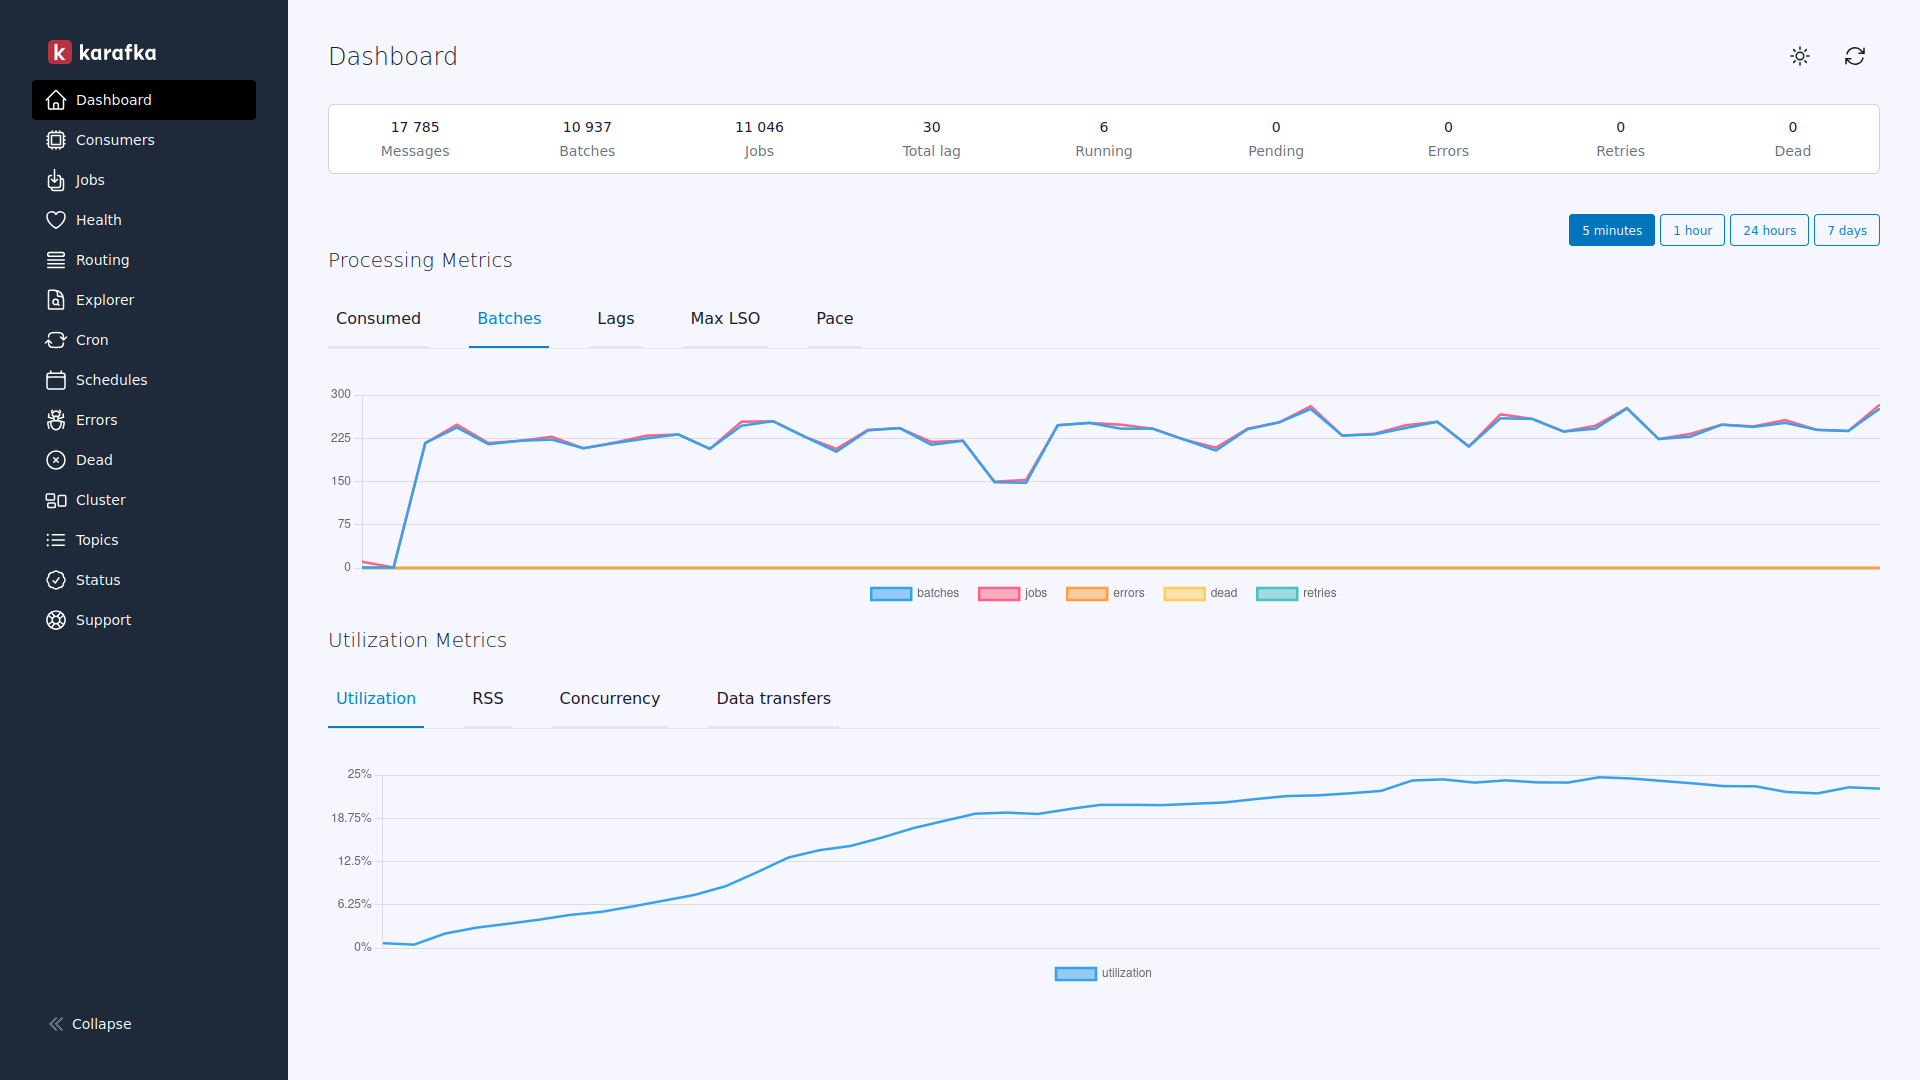
You can read more about its features here, and the installation documentation can be found here.
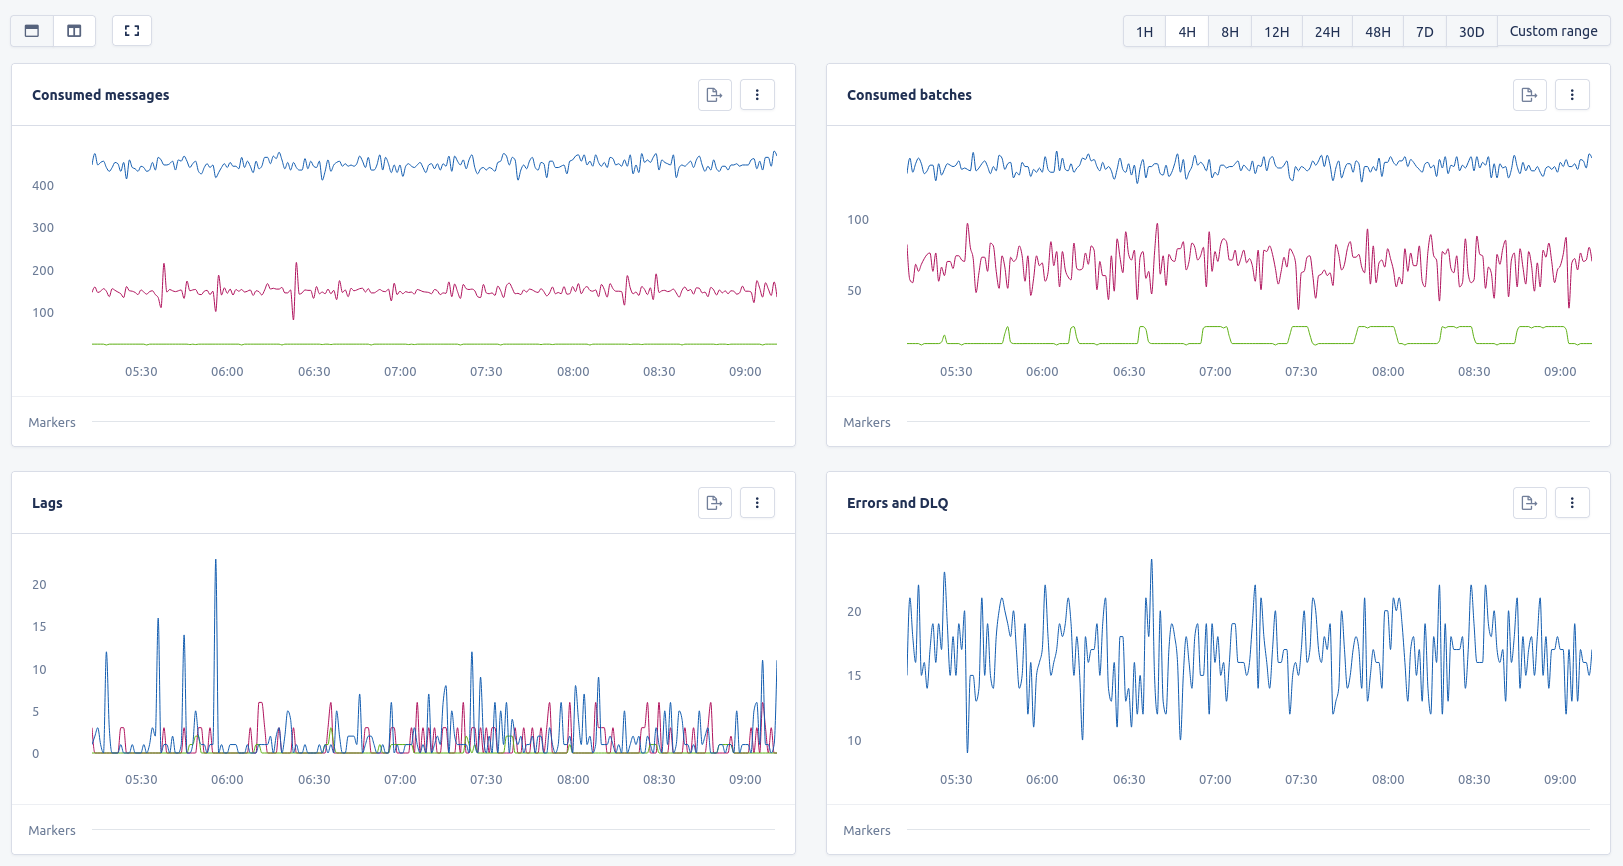
AppSignal Metrics and Error Tracking
AppSignal has had and continues to have, a tremendous impact on the Karafka ecosystem. Without their invaluable contributions and support, the progress and evolution of this ecosystem would not have been possible. For those searching for a top-notch monitoring system for Ruby and Rails applications, AppSignal stands out as a prime choice. Karafka officially recommends AppSignal as the supported integration for its community and users.
Karafka's integration with AppSignal offers comprehensive support for error reporting and performance monitoring, making it a seamless solution for monitoring your Kafka-based applications.
The Karafka AppSignal integration provides an extensive set of metrics with both per-topic and per-partition resolution. This granularity allows you to drill down into specific aspects of your Kafka processing pipeline.
Key Metrics Include:
-
Performance Metrics: Monitor the performance of your Karafka consumers, ensuring optimal message processing times.
-
Error Reporting: Gain insights into errors and exceptions within your Karafka application. AppSignal will help you identify and diagnose issues quickly, including asynchronous operation-related errors.
-
Dead Letter Queue: Keep an eye on messages that have failed to be processed and understand why they ended up in the dead letter queue.
By using the Karafka AppSignal integration, you can proactively manage your Kafka-based applications, ensuring they operate smoothly and reliably.
When setting up listeners for both metrics and errors, it's crucial to subscribe to the error listener first and then the metrics listener. Doing so in reverse may result in incorrect propagation of namespace and transaction details, leading to potential data inconsistencies. Ensure the correct sequence for accurate monitoring and data integrity.
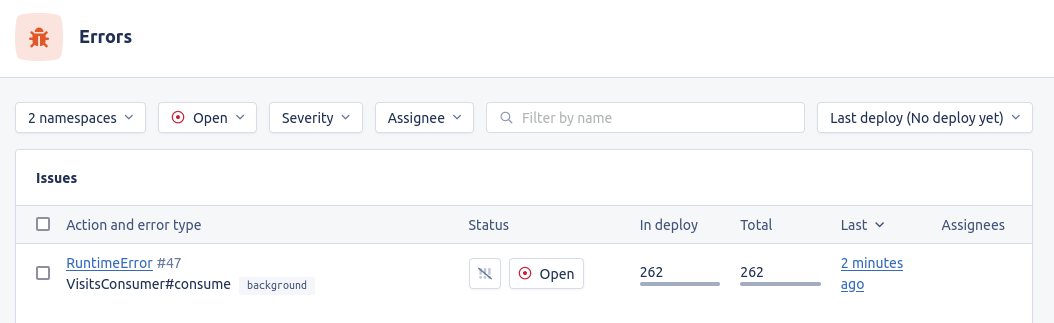
Error Tracking
Monitoring errors in Karafka consumers and producers is as critical as tracking performance and stability. Doing so provides a holistic view of system health, ensuring no issues or anomalies are overlooked. With the integration of Appsignal, you gain an additional layer of instrumentation specifically for this purpose. Appsignal integration tracks and reports all errors, including the internal asynchronous ones that might arise while working with Kafka. This comprehensive error tracking ensures timely detection and resolution, safeguarding your Kafka operations' integrity and reliability.
Below, you can find instructions on how to enable the errors instrumentation:
# First configure your app in karafka.rb
class KarafkaApp < Karafka::App
  setup do |config|
    # setup goes here...
  end
end

# require appsignal errors listener as it is not loaded by default
require 'karafka/instrumentation/vendors/appsignal/errors_listener'

# Create an appsignal errors listener
appsignal_errors_listener = ::Karafka::Instrumentation::Vendors::Appsignal::ErrorsListener.new

# Subscribe with your errors listener to Karafka and its producer and you should be ready to go!
Karafka.monitor.subscribe(appsignal_errors_listener)
Karafka.producer.monitor.subscribe(appsignal_errors_listener)

# setup the metrics listener here if you want
Metrics Instrumentation
The AppSignal integration offers comprehensive instrumentation, ensuring that you have a clear view of your application's performance and other vital metrics. In addition, a ready-to-import dashboard has been made available for instant insights. You can access and explore this dashboard here.
Below, you can find instructions on how to enable the metrics instrumentation:
# First configure your app in karafka.rb
class KarafkaApp < Karafka::App
  setup do |config|
    # setup goes here...
  end
end

# require appsignal metrics listener as it is not loaded by default
require 'karafka/instrumentation/vendors/appsignal/metrics_listener'

# Create an appsignal metrics listener
appsignal_metrics_listener = ::Karafka::Instrumentation::Vendors::Appsignal::MetricsListener.new

# Subscribe with your listener to Karafka and you should be ready to go!
Karafka.monitor.subscribe(appsignal_metrics_listener)
Remember to import the Appsignal ready-to-import dashboard that you can find here.
Sentry Error Tracking Integration
If you are using Sentry and want to track errors that occurred in Karafka for both consumptions as well as any errors happening in the background threads, all you need to do is to connect to the error.occurred using Sentry #capture_exception API:
Karafka.monitor.subscribe 'error.occurred' do |event|
  Sentry.capture_exception(event[:error])
end
Datadog and StatsD integration
Two DataDog Integration Options Available
Karafka offers two DataDog integration options: a native Karafka-maintained instrumentation (documented below) and DataDog's own Ruby APM integration. You cannot use both simultaneously as they may conflict with each other. The native Karafka integration provides Kafka-specific metrics and is maintained by us to ensure timely updates and compatibility with new Karafka releases, independent of DataDog's release cycles. DataDog's APM offers broader Ruby application monitoring. Choose the one that best fits your monitoring needs.
Enable WaterDrop Instrumentation Separately
WaterDrop has a separate instrumentation layer that you need to enable if you want to monitor both the consumption and production of messages. Please go here for more details.
Karafka Native DataDog Integration
Karafka comes with (optional) full Datadog and StatsD integration that you can use. To use it:
# First configure your app in karafka.rb
class KarafkaApp < Karafka::App
  setup do |config|
    # setup goes here...
  end
end

# require datadog/statsd and the listener as it is not loaded by default
require 'datadog/statsd'
require 'karafka/instrumentation/vendors/datadog/metrics_listener'

# initialize the listener with statsd client
dd_listener = ::Karafka::Instrumentation::Vendors::Datadog::MetricsListener.new do |config|
  config.client = Datadog::Statsd.new('localhost', 8125)
  # Publish host as a tag alongside the rest of tags
  config.default_tags = ["host:#{Socket.gethostname}"]
end

# Subscribe with your listener to Karafka and you should be ready to go!
Karafka.monitor.subscribe(dd_listener)
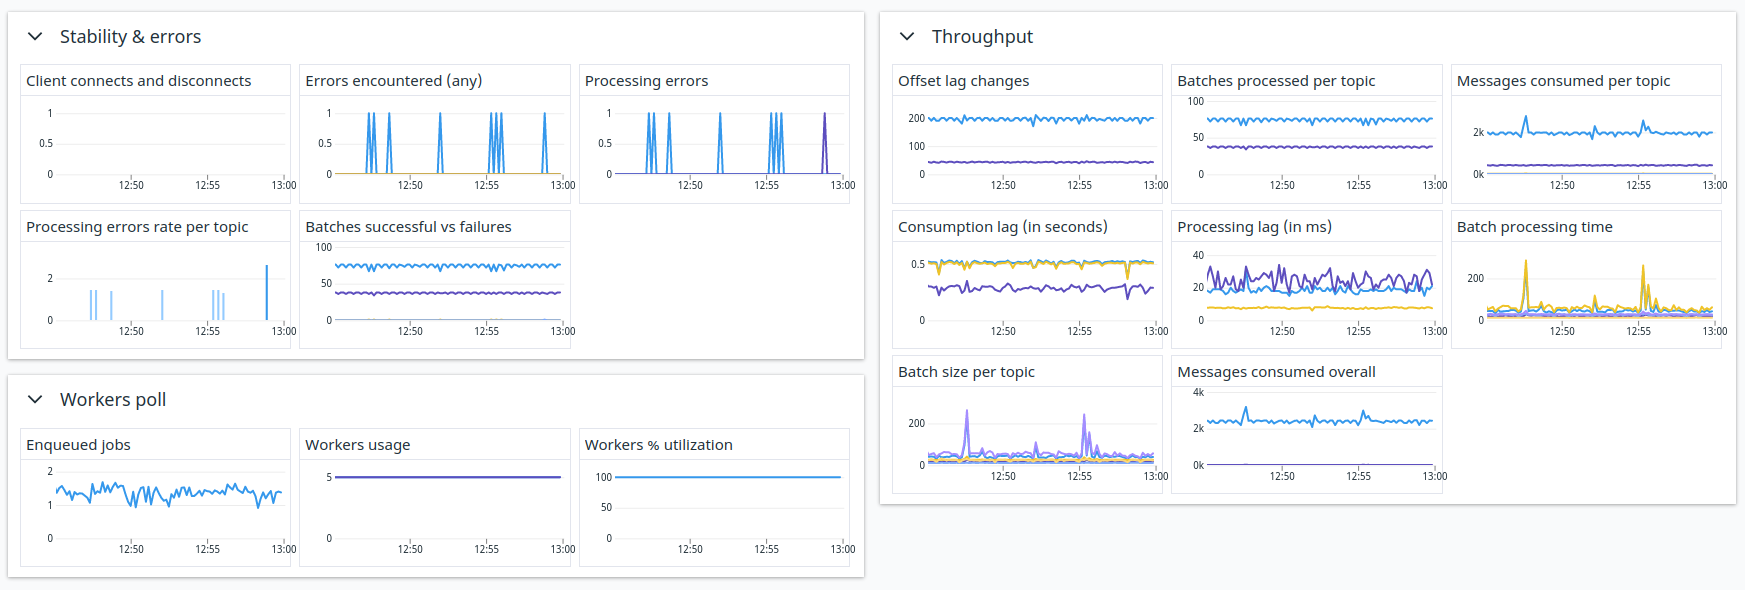
You can also find here a ready-to-import Datadog dashboard configuration file that you can use to monitor your consumers.
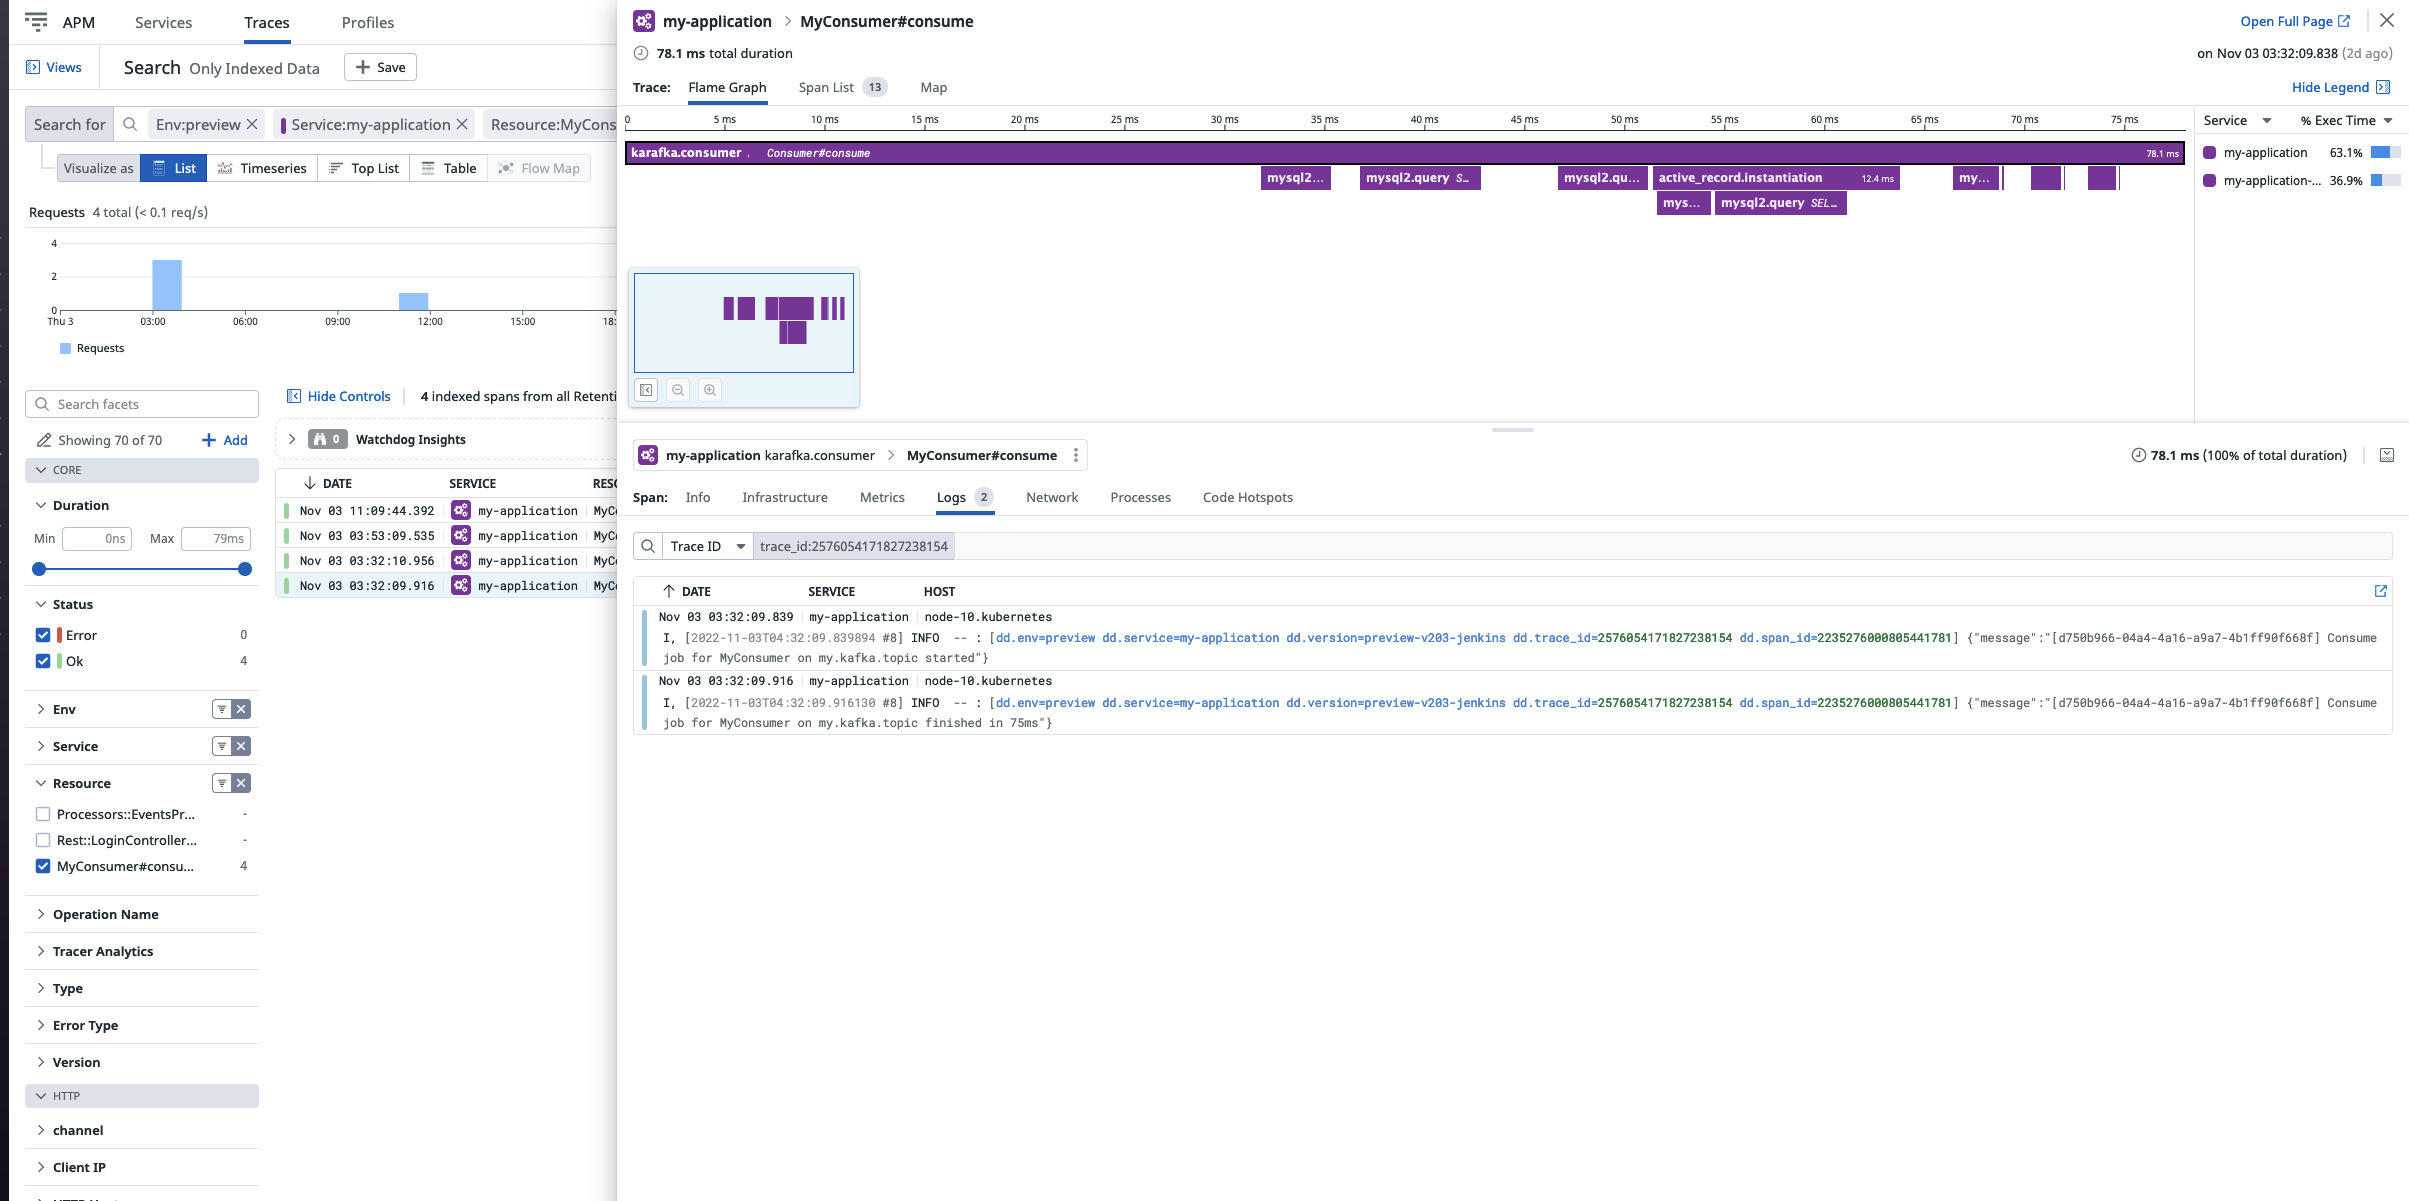
Tracing Consumers using Datadog Logger Listener
If you are interested in tracing your consumers' work with Datadog, you can use our Datadog logger listener:
# you need to add ddtrace to your Gemfile
require 'ddtrace'
require 'karafka/instrumentation/vendors/datadog/logger_listener'

# Initialize the listener
dd_logger_listener = Karafka::Instrumentation::Vendors::Datadog::LoggerListener.new do |config|
  config.client = Datadog::Tracing
end

# Use the DD tracing only for staging and production
Karafka.monitor.subscribe(dd_logger_listener) if %w[staging production].include?(Rails.env)
Tracing capabilities were added by Bruno Martins.
Async Producer Tracing With The Consumption Context
Tracing asynchronous producer operations in data consumption requires a mechanism to persist the trace context from consumer to producer. This ensures that a message's lifecycle - from consumption to its asynchronous production and delivery is fully traceable coherently. This is crucial for systems where you must maintain traceability across distributed systems and ensure that messages produced asynchronously are linked to their consumption traces.
One powerful tool to facilitate this traceability in Karafka using Datadog is the WaterDrop Labeling API. It allows you to attach consumer trace information directly to messages being produced, preserving the trace context. This enables Datadog to accurately associate the producer actions with the consumer context, without prematurely finalizing the trace.
Here's how you can modify the message payload to include trace context information:
# Check if there is an active parent span already (for example from consumer)
parent_span = Datadog::Tracing.active_span
span = Datadog::Tracing.trace('karafka.producer.produce')
# Set some defaults on your span if needed
set_span_tags(span, message, DEFAULT_SPAN_TAGS)

label = { span: span }

# If there is a parent span that is from the consumer, include it in the label so
# it gets passed into the producer flow
if parent_span && parent_span.name.start_with?('karafka.consumer')
  label[:parent_span] = parent_span
end

kafka_message[:label] = label

Karafka.producer.produce_async(kafka_message)
To complete the tracing lifecycle, you must handle the acknowledgment of message delivery or manage delivery failures. This involves finalizing the spans you initiated during the production step.
Here's how to handle the finalization of the trace when a message is acknowledged or when an error occurs:
def on_message_acknowledged(event)
  report = event[:delivery_report]
  label = report.label

  if label
    span = label[:span]

    if span
      # update offset and partition tags
      span.set_tag('offset', report.offset)
      span.set_tag('partition', report.partition)
      span.finish
    end

    # close parent span (karafka.consumer trace)
    label[:parent_span]&.finish
  end
end

def on_error_occurred(event)
  if event[:type] == 'librdkafka.dispatch_error'
    report = event[:delivery_report]
    label = report.label

    if label
      span = label[:span]
      message = label[:message]
      err = report.error
      # set the error in case it's not set
      span.set_error(err) if span.status.zero?
      span.finish

      # close parent span (karafka.consumer trace)
      label[:parent_span]&.finish

      # additional error handling behavior follows
      # ...
    end
  end
end
In these methods, the #on_message_acknowledged is responsible for finalizing the span when the message is successfully delivered, updating the trace with the offset and partition information. The #on_error_occurred method handles situations where a delivery error occurs, ensuring that the span is marked with the error and then finished.
By leveraging these mechanisms, you can maintain a continuous trace from the point of message consumption to its final acknowledgment in the production process, providing a comprehensive view of your data's lifecycle within the distributed system.
DataDog Ruby APM Integration
DataDog also provides their own Ruby APM integration that can automatically instrument Karafka applications.
This integration offers broader Ruby application monitoring capabilities beyond just Kafka metrics. However, since this instrumentation is maintained by DataDog, we do not control its release cycles or compatibility updates with new Karafka versions.
For setup instructions and configuration details, refer to the DataDog Ruby APM documentation.
Do Not Use Both Integrations Simultaneously
Do not use this integration alongside the native Karafka DataDog integration as they may conflict with each other. Choose the one that best fits your monitoring needs.
Kubernetes
Kubernetes is an open-source platform for automating the deployment and management of containerized applications. For integrating Karafka with Kubernetes, including liveness probe setup, detailed guidance is provided in the Deployment section.
OpenTelemetry
WaterDrop has a separate instrumentation layer that you need to enable if you want to monitor both the consumption and production of messages. You can use the same approach as Karafka and WaterDrop share the same core monitoring library.
OpenTelemetry does not support async tracing in the same way that Datadog does. Therefore it is impossible to create a tracer that will accept reporting without the code running from within a block nested inside the #in_span method.
Because of this, you need to subclass the default Monitor and inject the OpenTelemetry tracer into it. Below is an example that traces the consumer.consumed event. You can use this approach to trace any events Karafka publishes:
class MonitorWithOpenTelemetry < ::Karafka::Instrumentation::Monitor
  # Events we want to trace with OpenTelemetry
  TRACEABLE_EVENTS = %w[
    consumer.consumed
  ].freeze

  def instrument(event_id, payload = EMPTY_HASH, &block)
    # Always run super, so the default instrumentation pipeline works
    return super unless TRACEABLE_EVENTS.include?(event_id)

    # If event is trackable, run it inside the opentelemetry tracer
    MyAppTracer.in_span(
      "karafka.#{event_id}",
      attributes: extract_attributes(event_id, payload)
    ) { super }
  end

  private

  # Enrich the telemetry with custom attributes information
  def extract_attributes(event_id, payload)
    payload_caller = payload[:caller]

    case event_id
    when 'consumer.consumed'
      {
        'topic' => payload_caller.topic.name,
        'consumer' => payload_caller.class.to_s
      }
    else
      raise ArgumentError, event_id
    end
  end
end
Once created, assign it using the config.monitor setting:
class KarafkaApp < Karafka::App
  setup do |config|
    config.monitor = MonitorWithOpenTelemetry.new
  end
end
Example Listener with Errbit/Airbrake Support
Here's a simple example of a listener used to handle errors logging into Airbrake/Errbit.
# Example Airbrake/Errbit listener for error notifications in Karafka
module AirbrakeListener
  def on_error_occurred(event)
    Airbrake.notify(event[:error])
  end
end
Publishing Karafka and WaterDrop notifications events using ActiveSupport::Notifications
If you already use ActiveSupport::Notifications for notifications event tracking, you may also want to pipe all the Karafka and WaterDrop notifications events there.
To do so, subscribe to all Karafka and WaterDrop events and publish those events via ActiveSupport::Notifications:
# Karafka subscriptions piping
::Karafka::Instrumentation::Notifications::EVENTS.each do |event_name|
  ::Karafka.monitor.subscribe(event_name) do |event|
    # Align with ActiveSupport::Notifications default naming convention
    event = (event_name.split('.').reverse << 'karafka').join('.')

    # Instrument via ActiveSupport
    ::ActiveSupport::Notifications.instrument(event_name, **event.payload)
  end
end
# WaterDrop subscriptions piping
::WaterDrop::Instrumentation::Notifications::EVENTS.each do |event_name|
  ::Karafka.producer.subscribe(event_name) do |event|
    # Align with ActiveSupport::Notifications default naming convention
    event = (event_name.split('.').reverse << 'waterdrop').join('.')

    ::ActiveSupport::Notifications.instrument(event_name, **event.payload)
  end
end
Once that is done, you can subscribe directly to the events published there:
# Note that the events naming is reverted to follow ActiveSupport::Notifications conventions
ActiveSupport::Notifications.subscribe('consumed.consumer.karafka') do |event|
  Rails.logger.info "[consumer.consumed]: #{event.inspect}"
end
Please note that each Karafka producer has its instrumentation instance, so if you use more producers, you need to pipe each of them independently.
Monitor Wrapping and Replacement
Karafka's monitor can be replaced or wrapped to add custom instrumentation while preserving core functionality. This allows distributed tracing, custom metrics, or enhanced error tracking to be added in case async tracing is not available.
class CustomMonitor < ::Karafka::Instrumentation::Monitor
  # Events where we want custom handling
  INTERCEPTED_EVENTS = %w[
    consumer.consumed
    consumer.heartbeat
    consumer.polling.started
  ].freeze

  def instrument(event_id, payload = EMPTY_HASH, &block)
    return super unless INTERCEPTED_EVENTS.include?(event_id)

    # Pre-processing
    MyLogger.info("Starting #{event_id}")

    # Maintain core functionality
    super
  ensure
    # Post-processing (runs even after errors)
    MyMetrics.increment("karafka.#{event_id}")
  end
end

# Use custom monitor
class KarafkaApp < Karafka::App
  setup do |config|
    config.monitor = CustomMonitor.new
  end
end
Such a custom monitor will intercept specific events while delegating to the parent monitor to maintain framework functionality. This pattern enables proper error handling, cleanup, and integration with external monitoring systems that require execution to be wrapped in a block.
Avoid Calling super Multiple Times in Custom Monitors
When overriding Karafka’s instrumentation monitor (Karafka::Instrumentation::Monitor), it's crucial not to invoke super more than once within the instrument method. Calling super multiple times will cause the original wrapped block of code to execute repeatedly. This can lead to severe and unintended side-effects, such as duplicated message processing, incorrect consumption behaviors, and unexpected logic execution. Always ensure your custom monitor calls super exactly once per event, guarding against unintended duplicate invocations.
Implications of Broken Instrumentation listeners/listeners Causing Errors
Instrumentation and monitoring listeners are essential components in Karafka-based applications as they provide insight into the app's performance and behavior. They are critical in collecting metrics, measuring response times, and tracking other performance data. When functioning correctly, they enable efficient identification of issues and performance optimization. However, their malfunctioning could lead to several challenges and problems.
The first significant impact of broken instrumentation and monitoring listeners is the loss of visibility into the application's internal workings. This obscures your understanding of its performance and makes debugging more difficult. Such listeners are instrumental in spotting errors, bottlenecks, and irregular behaviors in your Karafka applications. Their malfunctioning can thus complicate the identifying of the root causes of issues and effective debugging.
Secondly, faulty listeners can adversely affect your Karafka application's performance. Their roles include collecting metrics and measuring response times, among other performance-related tasks. Any malfunctioning might result in missing essential performance bottlenecks, leading to performance degradation like decreased throughput and increased latency.
In specific scenarios, instrumentation errors in the Kafka listener threads can force Karafka into a recovery mode, causing continuous attempts to reconnect to Kafka and triggering rebalances. This can temporarily halt message consumption and impact workload distribution among consumer instances. Furthermore, instrumentation listener errors in worker threads responsible for processing messages might prevent proper acknowledgment of work or cause double processing of messages, resulting in issues like message loss or duplicate processing.
For those using custom instrumentation listeners, it's vital to ensure they are thoroughly tested and not performing heavy or error-prone tasks. These listeners can introduce additional complexity, and maintaining a balance between gathering valuable insights and keeping the listeners lightweight and error-free is essential.
To avert these issues, it's crucial to ensure your Karafka applications' instrumentation and monitoring listeners function correctly.
In conclusion, maintaining the stability, performance, and reliability of Karafka-based applications requires the proper functioning of any custom instrumentation and monitoring listeners.
Last modified: 2025-06-12 10:26:20