Deployment
Karafka is currently being used in production with the following deployment methods:
- systemd (+ Capistrano)
- Docker
- AWS + MSK (Fully Managed Apache Kafka)
- Heroku
- Kubernetes
- Confluent Cloud
- Custom OAuth Token Providers
Since the only thing that is long-running is the Karafka server, it shouldn't be hard to make it work with other deployment and CD tools.
systemd (+ Capistrano)
You can easily manage Karafka applications with systemd. Here's an example .service file that you can use.
# Move to /lib/systemd/system/karafka.service
# Run: systemctl enable karafka

[Unit]
Description=karafka
After=syslog.target network.target

[Service]
Type=simple

WorkingDirectory=/opt/current
ExecStart=/bin/bash -lc 'bundle exec karafka server'
User=deploy
Group=deploy
UMask=0002

RestartSec=1
Restart=on-failure

# output goes to /var/log/syslog
StandardOutput=syslog
StandardError=syslog

# This will default to "bundler" if we don't specify it
SyslogIdentifier=karafka

[Install]
WantedBy=multi-user.target
If you want to use systemd based solution together with Capistrano, you don't need the capistrano-karafka gem. Instead, you can use this simple Capistrano .cap file:
# frozen_string_literal: true

after 'deploy:starting', 'karafka:stop'
after 'deploy:published', 'karafka:start'
after 'deploy:failed', 'karafka:restart'

namespace :karafka do
  task :start do
    on roles(:app) do
      execute :sudo, :systemctl, :start, 'karafka'
    end
  end

  task :stop do
    on roles(:app) do
      execute :sudo, :systemctl, :stop, 'karafka'
    end
  end

  task :restart do
    on roles(:app) do
      execute :sudo, :systemctl, :restart, 'karafka'
    end
  end

  task :status do
    on roles(:app) do
      execute :sudo, :systemctl, :status, 'karafka'
    end
  end
end
If you need to run several processes of a given type, please refer to template unit files.
Docker
Karafka can be dockerized as any other Ruby/Rails app. To execute karafka server command in your Docker container, just put this into your Dockerfile:
ENV KARAFKA_ENV production
CMD bundle exec karafka server
AWS + MSK (Fully Managed Apache Kafka)
First of all, it is worth pointing out that Karafka, similar to librdkafka does not support SASL mechanism for AWS MSK IAM that allows Kafka clients to handle authentication and authorization with MSK clusters through AWS IAM. This mechanism is a proprietary idea that is not part of Kafka.
Karafka does, however, support:
Please follow the below instructions for both cluster initialization and Karafka configuration or go to the Custom Oauth Token Providers section.
AWS Integration with Custom OAuth Token Providers
While Karafka can be deployed on AWS using the Custom OAuth Token provider flow, additional code or gems may be required to fetch the tokens when necessary. This code is not included in the standard Karafka setup, so you must implement or integrate it based on your authentication provider's requirements.
AWS MSK cluster setup
- Navigate to the AWS MSK page and press the
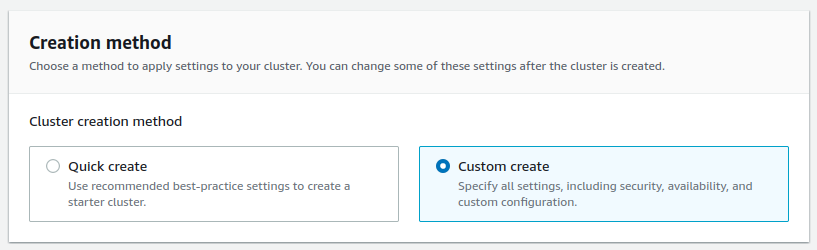
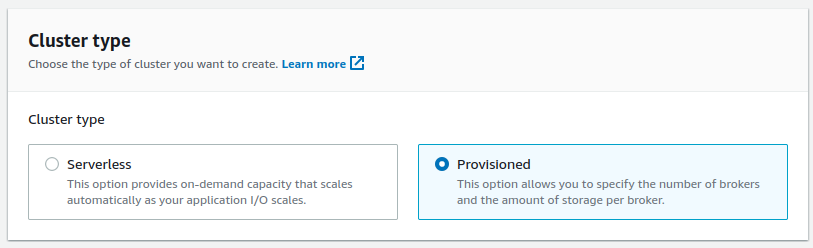
Create clusterbutton. - Select
Custom createandProvisionedsettings.
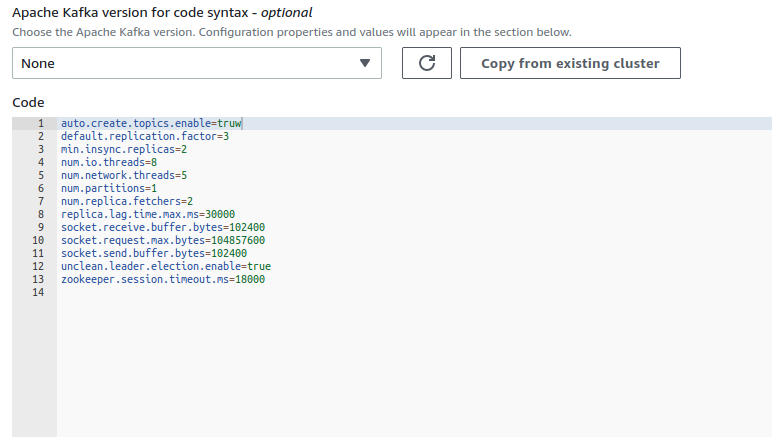
- Use custom config and set
auto.create.topics.enabletotrueunless you want to create topics using Kafka API. You can change it later, and in general, it is recommended to disallow auto-topic creation (typos, etc.), but this can be useful for debugging.
- Setup your VPC and networking details.
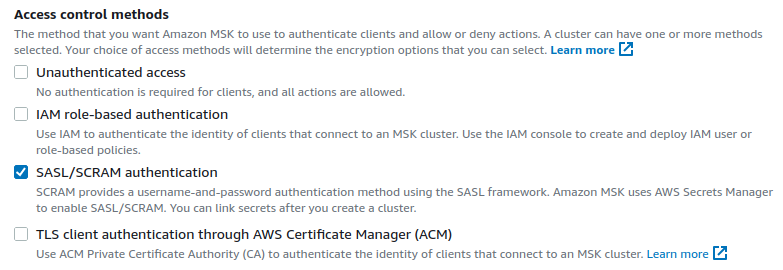
- Make sure that you disable the
Unauthenticated accessoption. With it enabled, there won't be any authentication beyond those imposed by your security groups and VPC. - Disable
IAM role-based authentication. - Enable
SASL/SCRAM authentication
- Provision your cluster.
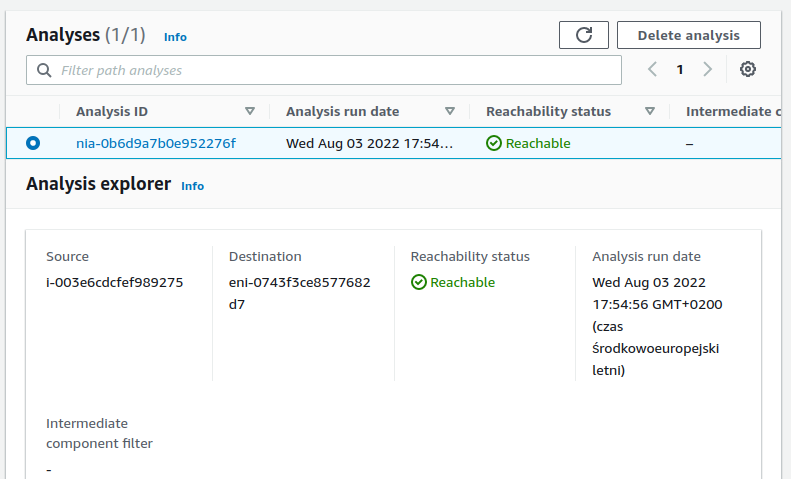
- Make sure your cluster is accessible from your machines. You can test it by using the AWS VPC Reachability Analyzer.
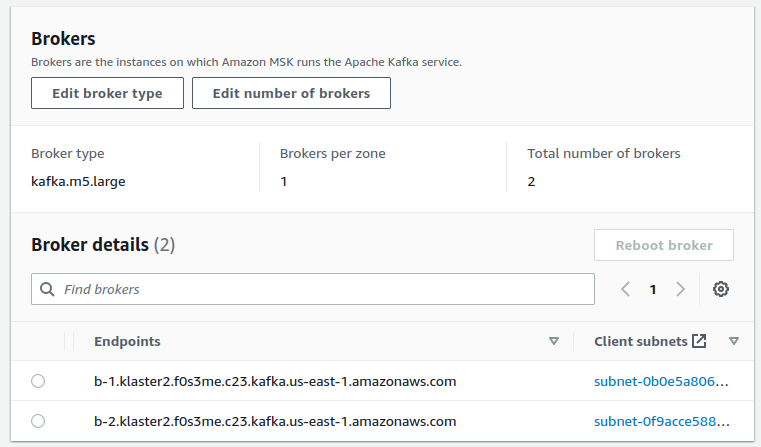
- Visit your cluster
Propertiespage and copy theEndpointsaddresses.
- Log in to any of your machines and run a
telnetsession to any of the brokers:
telnet your-broker.kafka.us-east-1.amazonaws.com 9096

Trying 172.31.22.230...
Connected to your-broker.kafka.us-east-1.amazonaws.com.
Escape character is '^]'.
^Connection closed by foreign host.
If you can connect, your settings are correct, and your cluster is visible from your instance.
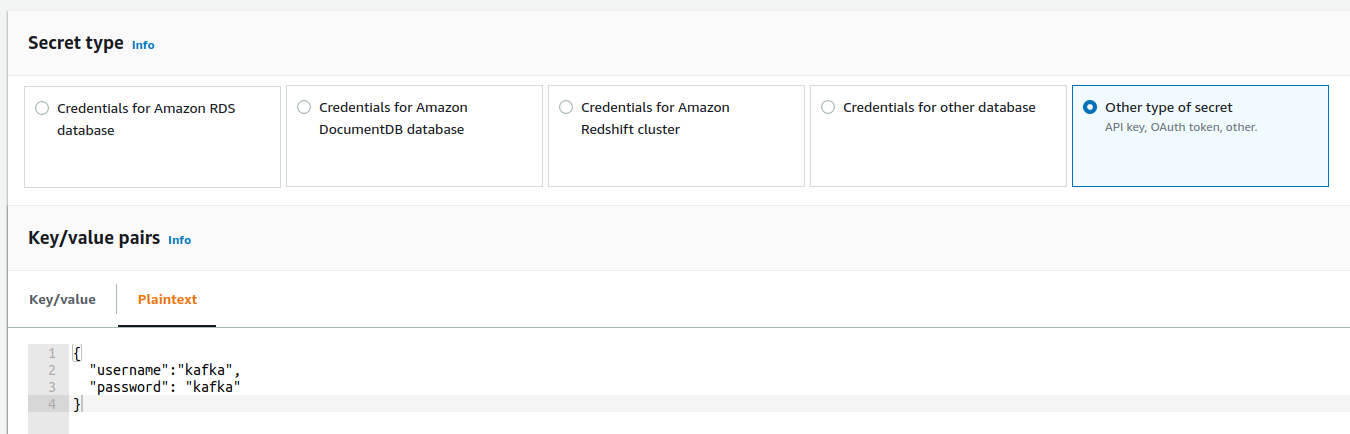
- Go to the AWS Secret Manager and create a key starting with
AmazonMSK_prefix. SelectOther type of secretandPlaintextand provide the following value inside of the text field:
- In the
Encryption keysection, press theAdd new key.
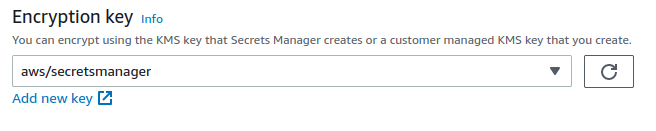
- Create a
Symmetrickey withEncrypt and decryptas a usage pattern.
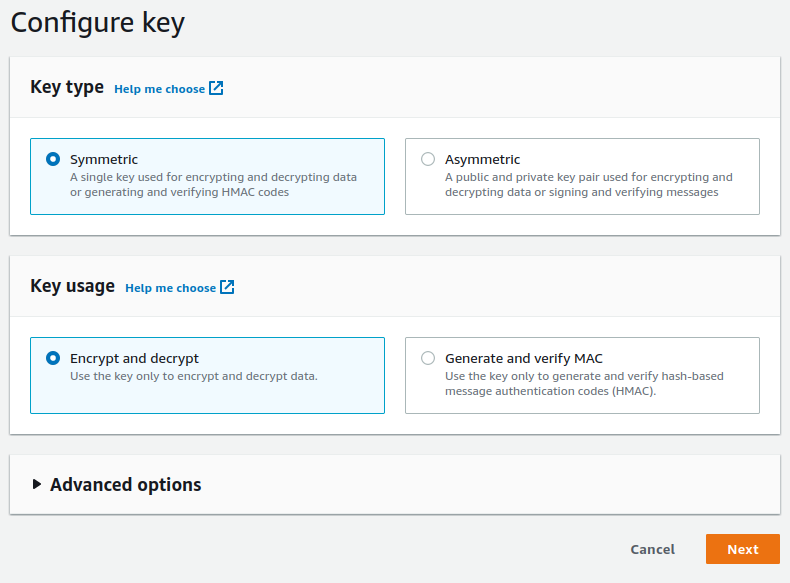
- Select your key in the
Encryption keysection and pressNext. - Provide a secret name and description and press
Nextuntil you reach theStorebutton. - Store your secret.
- Go back to the AWS MSK and select your cluster.
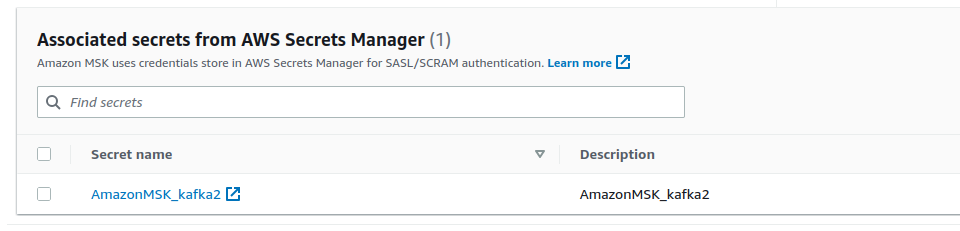
- Navigate to the
Associated secrets from AWS Secrets Managersection and pressAssociate secrets
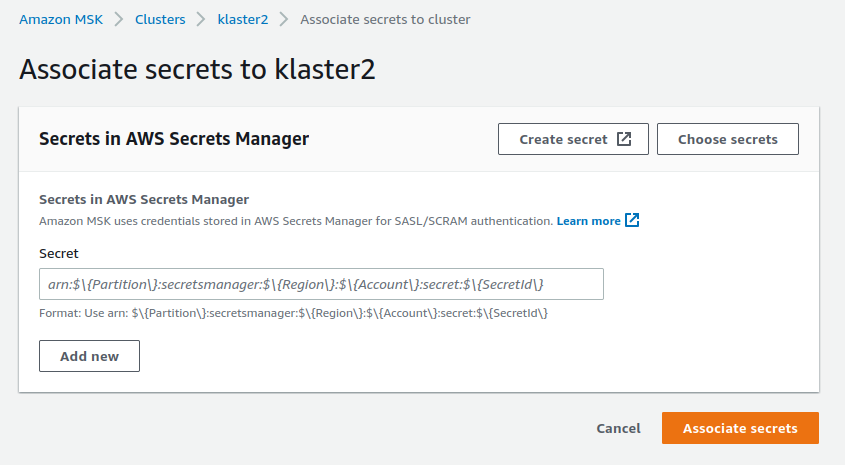
- Press the
Choose secretsand select the previously created secret.
- Press
Associate secrets. It will take AWS a while to do it. - Congratulations, you just configured everything needed to make it work with Karafka.
Karafka configuration for AWS MSK SASL + SSL
Provide the following details to the kafka section:
config.kafka = {
  'bootstrap.servers': 'yourcluster-broker1.amazonaws.com:9096,yourcluster-broker2.amazonaws.com:9096',
  'security.protocol': 'SASL_SSL',
  'sasl.username': 'username',
  'sasl.password': 'password',
  'sasl.mechanisms': 'SCRAM-SHA-512'
}
After that, you should be good to go.
Troubleshooting AWS MSK
Local: Authentication failure
ERROR -- : rdkafka: [thrd:sasl_ssl://broker1.kafka.us-east-1.amazonaws.]:
sasl_ssl://broker1.us-east-1.amazonaws.com:9096/bootstrap: SASL authentication error:
Authentication failed during authentication due to invalid credentials with SASL mechanism SCRAM-SHA-512
(after 312ms in state AUTH_REQ, 1 identical error(s) suppressed)

ERROR -- : librdkafka internal error occurred: Local: Authentication failure (authentication)
It may mean two things:
- Your credentials are wrong
- AWS MSK did not yet refresh its allowed keys, and you need to wait. Despite AWS reporting cluster as
Activewith no pending changes, it may take a few minutes for the credentials to start working.
Connection setup timed out in state CONNECT
rdkafka: [thrd:sasl_ssl://broker1.kafka.us-east-1.amazonaws.]:
sasl_ssl://broker1.us-east-1.amazonaws.com:9092/bootstrap:
Connection setup timed out in state CONNECT (after 30037ms in state CONNECT)
This means Kafka is unreachable. Check your brokers' addresses and ensure you use a proper port: 9096 with SSL or 9092 when plaintext. Also, make sure your instance can access AWS MSK at all.
Connection failures and timeouts
Please make sure that your instances can reach Kafka. Keep in mind that security group updates can have a certain lag in propagation.
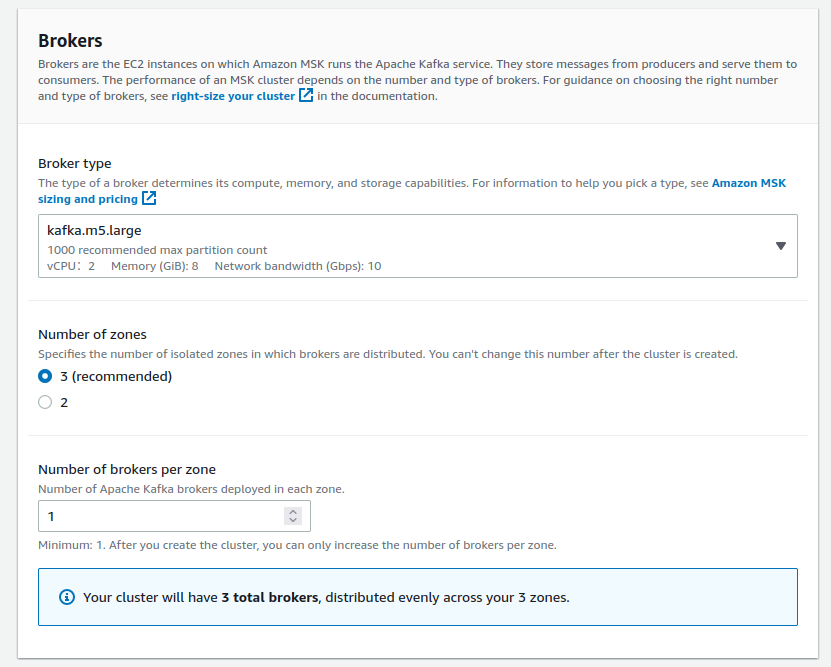
Rdkafka::RdkafkaError (Broker: Invalid replication factor (invalid_replication_factor))
Please make sure your custom setting default.replication.factor value matches what you have declared as Number of zones in the Brokers section:
Rdkafka::RdkafkaError: Broker: Topic authorization failed (topic_authorization_failed)
This error occurs in case you enabled Kafka ACL but did not grant proper ACL permissions to your users. It often happens when you make your AWS MSK public.
Please note that allow.everyone.if.no.acl.found false superseeds auto.create.topics.enable. This means that despite auto.create.topics.enable being set to true, you will not be able to auto-create topics as the ACL will block this.
We recommend creating all the needed topics before making the cluster public and assigning proper permissions via Kafka ACL.
If you want to verify that this is indeed an ACL issue, try running ::Karafka::Admin.cluster_info. If you get cluster info and no errors, you can connect to the cluster, but ACL blocks any usage.
::Karafka::Admin.cluster_info =>
#<Rdkafka::Metadata:0x00007fea8e3a43c0
 @brokers=[{:broker_id=>1001, :broker_name=>"your-kafka-host", :broker_port=>9092}],
 @topics=[]
>
You can also use this ACL command to give all operations access for the brokers on all the topics to a given user:
./bin/kafka-acls.sh \
  --authorizer-properties zookeeper.connect=<ZOOKEEPER_CONNECTION_STRING> \
  --add \
  --allow-principal User:<USER_NAME> \
  --allow-host=* \
  --operation All \
  --topic=* \
  --group=*
The above command must be run from a client machine with Java + Kafka installation, and the machine should also be able to communicate with the zookeeper nodes.
Heroku
Karafka works with the Heroku Kafka add-on, but it requires some extra configuration and understanding of how the Heroku Kafka add-on works.

Details about how Kafka for Heroku works can also be found here:
- https://devcenter.heroku.com/articles/kafka-on-heroku
- https://devcenter.heroku.com/articles/multi-tenant-kafka-on-heroku
- https://devcenter.heroku.com/articles/kafka-addon-migration
Heroku Kafka Prefix Convention
This section only applies to the Multi-Tenant add-on mode.
All Kafka Basic topics and consumer groups begin with a unique prefix associated with your add-on. This prefix is accessible via the KAFKA_PREFIX environment variable.
That means that in the multi-tenant mode, you must remember always to prefix all the topic names and all the consumer group names with the KAFKA_PREFIX environment variable value.
To make it work you need to follow few steps:
- Change the
group_idsetting to match yourKAFKA_PREFIX.
class KarafkaApp < Karafka::App
  setup do |config|
    # other config options...

    # Inject the prefix automatically to the default consumer group
    config.group_id = "#{ENV['KAFKA_PREFIX']}app"
  end
end
- If you use explicit consumer groups, ensure they are prefixed with
KAFKA_PREFIX.
class KarafkaApp < Karafka::App
  setup do |config|
    # ...
  end

  routes.draw do
    consumer_group "#{ENV['KAFKA_PREFIX']}my-group1" do
      topic :example do
        consumer ExampleConsumer
      end

      topic :example2 do
        consumer ExampleConsumer2
      end
    end

    consumer_group "#{ENV['KAFKA_PREFIX']}my-group2" do
      topic :example3 do
        consumer Example2Consumer3
      end
    end
  end
end
- Create all the consumer groups before using them via the Heroku CLI.
heroku kafka:consumer-groups:create CONSUMER_GROUP_NAME
The value of KAFKA_PREFIX typically is like smoothboulder-1234. which would make the consumer group in Karafka smoothboulder-1234.app. Kafka itself does not need to know the prefix when creating the consumer group.
This means that the Heroku CLI command needs to look as follows:
heroku kafka:consumer-groups:create app
This allows Heroku's multi-tenant setup to route smoothboulder-1234.app to your cluster correctly.
- When consuming, you always need to use the prefixed topic name:
class KarafkaApp < Karafka::App
  # ...
  routes.draw do
    topic "#{ENV['KAFKA_PREFIX']}users_events" do
      consumer UsersEventsConsumer
    end
  end
end
- When producing, you always need to use the prefixed topic name:
Karafka.producer.produce_async(
  topic: "#{ENV['KAFKA_PREFIX']}users_events",
  payload: {
    user_id: user.id,
    event: 'user.deleted'
  }.to_json
)
- When using
Karafka::AdminandKarafka::Webplease make sure to create appropriate consumer groups as well.
class KarafkaApp < Karafka::App
  setup do |config|
    # other config options...

    # Make Karafka admin use such a group ID
    config.admin.group_id = "#{ENV['KAFKA_PREFIX']}karafka-admin-extra"
  end
end

Karafka::Web.setup do |config|
  # other config options...
  config.group_id = "#{ENV['KAFKA_PREFIX']}karafka-web-ui"
end
# Since both are set to karafka_admin by default, if you did not change those values,
# you can just run:
heroku kafka:consumer-groups:create karafka_admin

# If you did change them according to the above example, create all the groups needed:

# Create the admin consumer group
heroku kafka:consumer-groups:create karafka-admin-extra

# Create the web ui consumer group
heroku kafka:consumer-groups:create karafka-web-ui
You will need to configure your topics in Kafka before they can be used. This can be done in the Heroku UI or via the CLI provided by Heroku. Be sure to name your topics without the KAFKA_PREFIX, e.g. heroku kafka:topics:create users_events --partitions 3.
Configuring Karafka to Work With Heroku SSL
When you turn on the add-on, Heroku exposes a few environment variables within which important details are stored. You need to use them to configure Karafka as follows:
class KarafkaApp < Karafka::App
  setup do |config|
    config.kafka = {
      # ...
      'security.protocol': 'ssl',
      # KAFKA_URL has the protocol that we do not need as we define the protocol separately
      'bootstrap.servers': ENV['KAFKA_URL'].gsub('kafka+ssl://', ''),
      'ssl.certificate.pem': ENV['KAFKA_CLIENT_CERT'],
      'ssl.key.pem': ENV['KAFKA_CLIENT_CERT_KEY'],
      'ssl.ca.pem': ENV['KAFKA_TRUSTED_CERT']
    }

    # ... other config options
  end
end
Heroku Retention Policy Impact on the Web UI
Heroku's one-day default retention policy for Kafka may affect Karafka Web UI's functionality and reliability, leading to a lack of data and operational issues. The Web UI depends on continuous data flow and requires access to historical data for analytics. A one-day policy is insufficient for Web UI topics. To improve stability and reliability, we recommend configuring your Web UI topics according to our recommended defaults, which can be found here.
Troubleshooting
There are few problems you may encounter when configuring things for Heroku:
Unsupported protocol "KAFKA+SSL"
parse error: unsupported protocol "KAFKA+SSL"
Solution: Make sure you strip off the kafka+ssl:// component from the KAFKA_URL env variable content.
Disconnected while requesting ApiVersion
Disconnected while requesting ApiVersion: might be caused by incorrect security.protocol configuration
(connecting to a SSL listener?)
Solution: Make sure all the settings are configured exactly as presented in the configuration section.
Topic authorization failed
Broker: Topic authorization failed (topic_authorization_failed) (Rdkafka::RdkafkaError)
Solution: Make sure to namespace all the topics and consumer groups with the KAFKA_PREFIX environment value.
Messages are not being consumed
DEBUG -- : [3732873c8a74] Polled 0 messages in 1000ms
DEBUG -- : [3732873c8a74] Polling messages...
DEBUG -- : [3732873c8a74] Polled 0 messages in 1000ms
DEBUG -- : [3732873c8a74] Polling messages...
DEBUG -- : [3732873c8a74] Polled 0 messages in 1000ms
Solution 1: Basic multi-tenant Kafka plans require a prefix on topics and consumer groups. Make sure that both your topics and consumer groups are prefixed.
Solution 2: Make sure you've created appropriate consumer groups prior to them being used via the Heroku CLI.
Missing Information or "Initial Consumers State Missing" Notice After a While
Please read the Heroku Retention Policy Impact on the Web UI section and apply correct Web UI topics configuration.
Kubernetes
Karafka can be easily deployed using Kubernetes. Since Karafka is often used for mission-critical applications that handle a high volume of messages, it's vital to ensure that the application stays healthy and responsive. Fortunately, Karafka supports liveness checks, which can be used to verify that the application is running correctly. With Kubernetes, it's easy to define liveness probes that periodically check the status of a Karafka application and restart the container if necessary. By using Kubernetes to deploy Karafka and configuring liveness probes, you can ensure that their mission-critical applications stay up and running, even in the face of unexpected failures.
Basic deployment spec
Below you can find the basic deployment spec for a Karafka consumer process:
apiVersion: apps/v1
kind: Deployment
metadata:
  name: karafka-deployment
  labels:
    app: app-name
spec:
  replicas: 5 # Number of processes you want to have
  selector:
    matchLabels:
      app: app-name
  strategy:
    type: Recreate
  template:
    metadata:
      labels:
        app: app-name
    spec:
      containers:
        - name: app-name
          image: app-docker-image
          command: ["bundle", "exec", "karafka", "server"]
          env:
            - name: KARAFKA_ENV
              value: production
When deploying Karafka consumers using Kubernetes, it's generally not recommended to use strategies other than Recreate. This is because other strategies, such as RollingUpdate may cause extensive rebalancing among the consumer processes. This can lead to slow deployments and double-processing of messages, which can be a significant problem.
For larger deployments with many consumer processes, it's especially important to be mindful of the rebalancing issue.
Overall, when deploying Karafka consumers using Kubernetes, it's important to consider the deployment strategy carefully and to choose a strategy that will minimize the risk of rebalancing issues. By using the Recreate strategy and configuring Karafka static group memberships and cooperative.sticky rebalance strategy settings, you can ensure that your Karafka application stays reliable and performant, even during large-scale deployments.
Liveness
There are many ways to define a liveness probe for a Kubernetes deployment, and the best approach depends on the application's specific requirements. We recommend using the HTTP liveness probe, as this is the most common type of liveness probe, which checks if the container is alive by sending an HTTP request to a specific endpoint. Karafka provides a base listener that starts a minimal HTTP server exposing basic health information about the running process using following HTTP codes:
200- Everything works as expected, with detailed JSON status information.500- Karafka process is not behaving as expected and should be restarted.
Karafka Kubernetes liveness listener can be initialized with two important thresholds: consuming_ttl and polling_ttl. These thresholds are used to determine if Karafka or the user code consuming from Kafka hangs for an extended time.
If the consuming_ttl threshold is exceeded, it suggests that the user code consuming from Kafka is taking too long. Similarly, if the polling_ttl is exceeded, this means that the polling does not happen often enough. In both cases, when either of these thresholds is surpassed, the liveness endpoint configured in Karafka will respond with an HTTP 500 status code.
This configuration allows you to handle scenarios where Karafka hangs, or the user code consuming from Kafka becomes unresponsive. By setting appropriate values for consuming_ttl and polling_ttl, you can tailor the liveness probe to detect and handle these situations effectively.
Important Note on Liveness Probes in Swarm Mode
The standard Karafka Kubernetes liveness listener is not suitable for Swarm Mode. In Swarm Mode, the default listener will cause Kubernetes to inaccurately mark the Karafka process as dead due to its inability to assess the health of individual swarm nodes correctly. Karafka offers a specialized liveness listener for Swarm Mode to ensure accurate health checks and prevent unnecessary restarts. Ensure you use the correct listener for Swarm Mode deployments to maintain your application's reliability in a Kubernetes environment.
Below you can find an example of how to require, configure and connect the liveness HTTP listener.
- Put following code at the end of your
karafka.rbfile:
require 'karafka/instrumentation/vendors/kubernetes/liveness_listener'

listener = ::Karafka::Instrumentation::Vendors::Kubernetes::LivenessListener.new(
  # If hostname not specified or nil, will bind to all the interfaces
  hostname: '192.168.1.100',
  port: 3000,
  # Make sure polling happens at least once every 5 minutes
  polling_ttl: 300_000,
  # Make sure that consuming does not hang and does not take more than 1 minute
  consuming_ttl: 60_000
)

Karafka.monitor.subscribe(listener)
- Expand your deployment spec with the following
livenessProbesection:
livenessProbe:
  httpGet:
    path: /
    port: 3000
  initialDelaySeconds: 30
  periodSeconds: 10
  timeoutSeconds: 5
The provided liveness listener is a generic implementation designed to handle common scenarios. However, it may not address all cases specific to your application's requirements. Fortunately, the listener serves as a solid foundation that can be customized and extended to create a more complex and tailored solution.
By using the provided listener as a starting point, you can have the flexibility to build your liveness probe that accommodates your unique needs. This can involve adding additional checks, implementing custom logic, or integrating with other monitoring systems to create a more comprehensive and sophisticated liveness solution.
Response Format
The liveness listener returns detailed health information in JSON format:
Healthy Response (200 OK):
{
  "status": "healthy",
  "timestamp": 1717251446,
  "port": 3000,
  "process_id": 12345,
  "errors": {
    "polling_ttl_exceeded": false,
    "consumption_ttl_exceeded": false,
    "unrecoverable": false
  }
}

**Unhealthy Response (500 Internal Server Error):**

```json
{
  "status": "unhealthy",
  "timestamp": 1717251500,
  "port": 3000,
  "process_id": 12345,
  "errors": {
    "polling_ttl_exceeded": true,
    "consumption_ttl_exceeded": false,
    "unrecoverable": false
  }
}
This response format allows for more granular monitoring and debugging while maintaining compatibility with existing Kubernetes liveness probe configurations that check for HTTP 2xx status codes.
Extending Liveness with #healthy?
The #healthy? method in the liveness listener is a public method that can be expanded to include additional application-specific health checks. By default, this method verifies whether the Karafka process operates as expected. However, you can override or extend it to include custom checks tailored to your application's requirements.
For example, if your application depends on external services (like a database or an API), you can extend the #healthy? method to ensure these services are also reachable. If any of these checks fail, you can return a 500 status, prompting Kubernetes to restart the container, thereby increasing the resilience of your deployment.
This flexibility allows you to go beyond the default liveness check, adding layers of health verification specific to your application's architecture and dependencies.
class LivenessListener < ::Karafka::Instrumentation::Vendors::Kubernetes::LivenessListener
  # Fail if redis that is required is down
  def healthy?
    return false unless super
    return false unless redis_alive?

    true
  end
end
Liveness In the Swarm Mode
Karafka provides a specialized Kubernetes liveness listener for applications operating in the Swarm Mode. This adaptation ensures accurate health monitoring and management of the supervisor process within the swarm
The SwarmLivenessListener is tailored to supervise the health of the Karafka supervisor process in Swarm Mode, addressing unique operational dynamics. It provides:
-
Controlling TTL: A configurable time-to-live (TTL) for supervising thread activity, ensuring the supervisor actively manages child nodes. Set this with consideration for normal and shutdown states to avoid false positives.
-
Minimal HTTP Server: Similar to the standard listener, it runs an HTTP server for health checks, responding with:
200: The supervisor is active and controlling, as expected, with detailed JSON status information.500: Supervisor activity is below the controlling_ttl, indicating potential issues.
To integrate the SwarmLivenessListener into your Karafka application, follow these steps:
- Embed the listener setup at the end of your
karafka.rbfile to initialize and subscribe the listener to your Karafka monitoring system:
require 'karafka/instrumentation/vendors/kubernetes/swarm_liveness_listener'

listener = ::Karafka::Instrumentation::Vendors::Kubernetes::SwarmLivenessListener.new(
  # Optional: Specify to bind to a specific interface
  hostname: '192.168.1.100',
  # TCP port for the HTTP server
  port: 3000,
  # TTL for supervisor control checks (in milliseconds)
  controlling_ttl: 60_000
)

Karafka.monitor.subscribe(listener)
- Adjust your deployment spec to include the liveness probe, targeting the listener's port and path.
livenessProbe:
  httpGet:
    path: /
    port: 3000
  initialDelaySeconds: 30
  periodSeconds: 10
  timeoutSeconds: 5
By using the SwarmLivenessListener, you leverage a tool crafted explicitly for the complexities of Swarm Mode, ensuring that Kubernetes accurately reflects the health of your distributed Karafka application, thus safeguarding against premature process restarts and enhancing overall system reliability.
Additional processes inside the same pod
The Liveness listener is configured to associate itself only with a running karafka server process in your container. This implies that if you intend to run a separate process like rails console within an active container, the listener will not attempt to associate with a port already in use.
require 'karafka/instrumentation/vendors/kubernetes/liveness_listener'

listener = ::Karafka::Instrumentation::Vendors::Kubernetes::LivenessListener.new(
  # config goes here...
)

Karafka.monitor.subscribe(listener)
Confluent Cloud
Deploying Karafka on Confluent Cloud offers a streamlined way to manage Kafka infrastructure with less overhead on physical or cloud infrastructure management. Here are the detailed steps and considerations for setting up Karafka with Confluent Cloud.
- Create a Confluent Cloud Account
Begin by registering for a Confluent Cloud account at Confluent.io. After registration, you can manage your Kafka clusters directly from the Confluent UI.
- Create a Kafka Cluster
- Navigate to the Confluent Cloud dashboard.
- Click on "Add Cluster" to configure a new Kafka cluster.
- Select the appropriate cloud provider and region that fits your application needs.
- Choose a Basic or Dedicated cluster plan depending on your scale requirements.
Region Selection
Ensure that the region selected has low latency to your application servers to reduce the message delivery time.
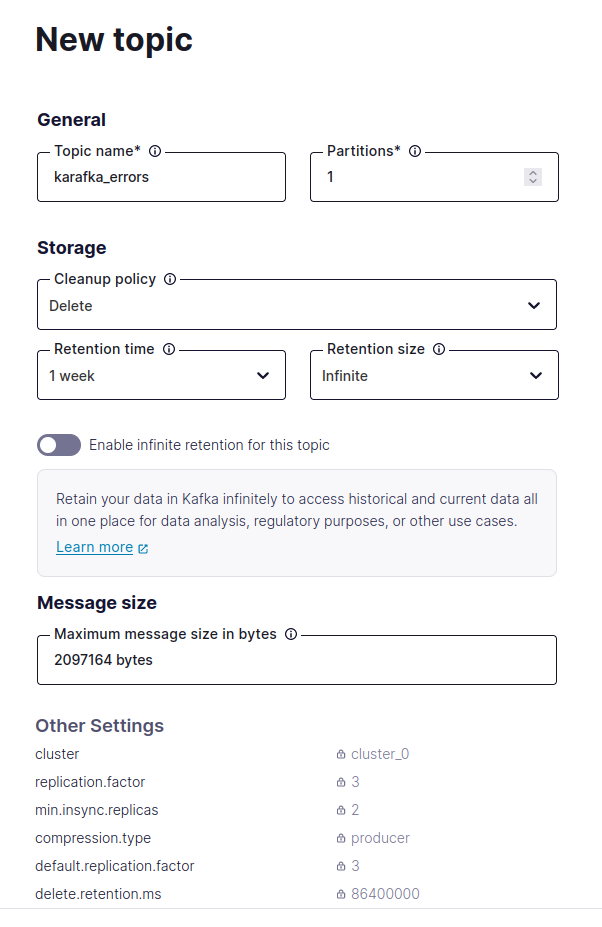
- Configure Kafka Topics
- Once your cluster is active, go to the 'Topics' tab and create the necessary topics that your application will use.
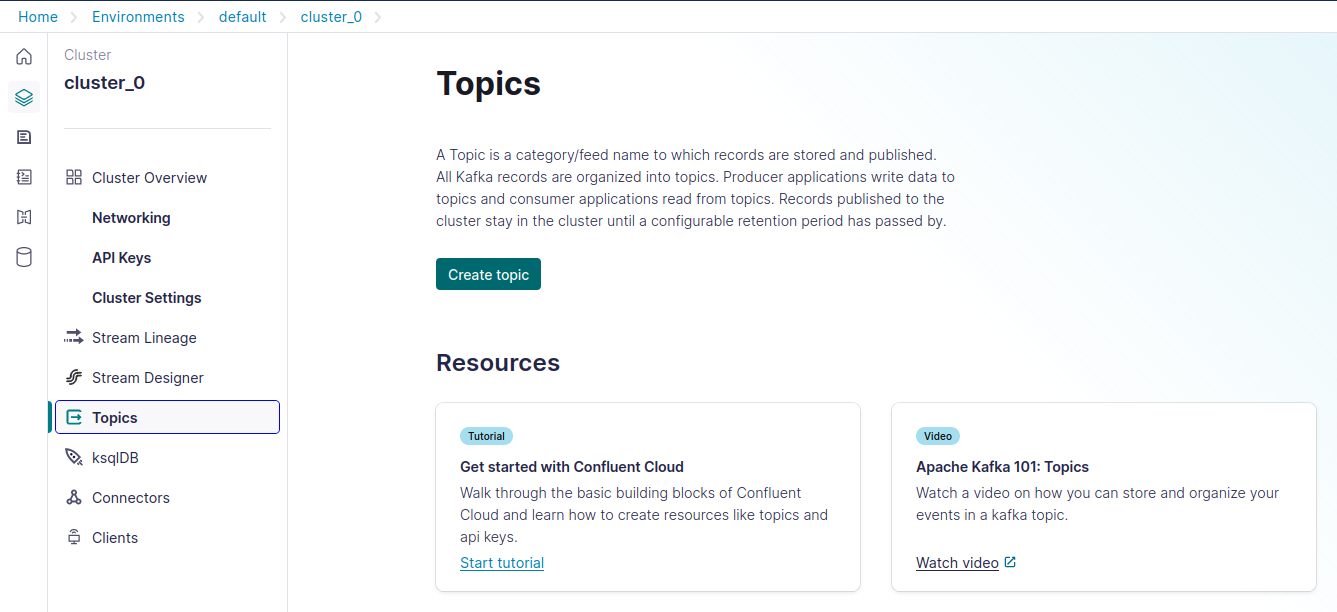
- Set appropriate partitions and retention policies based on your expected workload and data retention needs.
- Configure Web UI Topics
Since Confluent Cloud does not support automatic topic creation, you must ensure that all necessary Karafka Web UI topics are created before using the Web UI to monitor and manage your Kafka setup.
The detailed list and settings of all required Web UI topics are in the Karafka documentation under the Web UI Getting Started guide, specifically in the section on manual web UI topic management.
- Integration with Karafka
In your Karafka application, configure the Kafka client to connect to your Confluent Cloud cluster. You will need to specify several configurations provided by Confluent Cloud:
class KarafkaApp < Karafka::App
  setup do |config|
    config.kafka = {
      'allow.auto.create.topics': false,
      'bootstrap.servers': 'your-confluent-bootstrap-server.confluent.cloud:9092',
      'security.protocol': 'SASL_SSL',
      'sasl.username': 'CONFLUENT_USERNAME',
      'sasl.password': 'CONFLUENT_PASSWORD',
      'sasl.mechanisms': 'PLAIN'
    }

    # Other settings...
  end
end
Custom OAuth Token Providers
Karafka and its companion gem, WaterDrop, can integrate with any custom OAuth token provider, enabling secure communication with a Kafka cluster. This capability is instrumental in cloud environments like AWS, where securing access and credentials is crucial.
Karafka provides flexibility through a listener that allows integration with any OAuth token provider. This means that, even if your token provider is not part of the Karafka ecosystem, you can still use it by writing custom integration code.
Karafka and WaterDrop producers accept config.oauth.token_provider_listener, executed whenever tokens must be refreshed. Inside of the event object, there will be a :bearer on which you should invoke either:
#oauthbearer_set_tokenwith:token,:lifetime_msand:principal_name.#oauthbearer_set_token_failurewith a string reason explaining why the token was not obtained.
Default Producer Auto-Configuration
The default Karafka producer (Karafka.producer) does not need a separate configuration as it inherits the Kafka settings directly from the Karafka application configuration. However, if you use custom-initialized WaterDrop producers, remember that they require individual configuration.
Below is an example of how you can set up Karafka with AWS using a custom token refresher and how you can configure a custom WaterDrop producer instance:
class OAuthTokenRefresher
  # Refresh OAuth tokens when required by the Karafka connection lifecycle
  def on_oauthbearer_token_refresh(event)
    # Note that such library does not exist, it is an example
    signer = AwsAbstractTokenGenerator.new
    token = signer.generate_auth_token

    if token
      event[:bearer].oauthbearer_set_token(
        token: token.token,
        lifetime_ms: token.expiration_time_ms,
        principal_name: 'kafka-cluster'
      )
    else
      event[:bearer].oauthbearer_set_token_failure(
        token.failure_reason
      )
    end
  end
end

class KarafkaApp < Karafka::App
  setup do |config|
    # Other config options...

    config.kafka = {
      'bootstrap.servers': 'your-kafka-server:9098',
      'security.protocol': 'sasl_ssl',
      'sasl.mechanisms': 'OAUTHBEARER'
    }

    config.oauth.token_provider_listener = OAuthTokenRefresher.new
  end
end

# If you only use Karafka.producer, it will be auto-configured
CUSTOM_PRODUCER = WaterDrop::Producer.new do |config|
  config.kafka = {
    'bootstrap.servers': 'your-kafka-server:9098',
    'security.protocol': 'sasl_ssl',
    'sasl.mechanisms': 'OAUTHBEARER'
  }

  config.oauth.token_provider_listener = OAuthTokenRefresher.new
end
Last modified: 2025-06-11 13:58:20