# Optimized Statistics Processing at Scale
Karafka Pro includes automatic optimizations for Kafka client statistics handling in high-partition environments. In large-scale deployments with thousands of partitions per topic, the overhead of collecting, serializing, and processing metrics can become a significant, often invisible performance bottleneck.
## Optimized Statistics Processing at Scale / The Problem
In environments with high partition counts, the statistics mechanism generates disproportionately large payloads relative to the actual workload of a given consumer or producer process. Each statistics emit requires memory allocation and CPU time proportional to the total number of partitions known to the client, not just those being actively worked with.
At scale, this results in:
- **Oversized statistics payloads** that grow with topic partition count, not assignment size
- **Excessive memory allocations** on every statistics interval
- **Unnecessary CPU overhead** deserializing data irrelevant to the current process
## Optimized Statistics Processing at Scale / How Karafka Pro Solves This
Karafka Pro automatically reduces the overhead of statistics processing at multiple levels, ensuring that both the size of the statistics data and the cost of processing it scale with your actual workload rather than the total size of the Kafka cluster.
This optimization is **transparent and automatic** - no configuration changes are required.
## Optimized Statistics Processing at Scale / Performance Impact
| Scenario | Without Pro | With Pro | Reduction |
| --- | --- | --- | --- |
| Stats payload size | ~4.2 MB per emit | ~35 KB per emit | 99.2% smaller |
| Partitions in stats payload | ~2,001 | ~11 | 99.5% fewer |
| Memory allocations per event | ~4,053 objects | ~73 objects | 98.2% fewer |
| CPU time per stats decoration | ~28 ms | ~0.5 ms | 98.2% faster |
| RSS memory growth (per minute) | ~66 MB | ~4 MB | 94.1% less |
| GC collections (per minute) | 6 | 1 | 83.3% fewer |
*Benchmarked with a 2,000-partition topic, 10 assigned partitions, `statistics.interval.ms` = 5000ms (Karafka default), Ruby 4.0, Linux x86_64.*
### Optimized Statistics Processing at Scale / Performance Impact / Scaling by Partition Count
The charts below show how overhead scales from 100 to 5,000 total partitions. In each case, the consumer is assigned only 10 partitions - a realistic scenario where a process consumes a small slice of a large topic. Without Pro, all metrics grow linearly with the total number of partitions known to the client. With Pro, they remain constant regardless of cluster size.
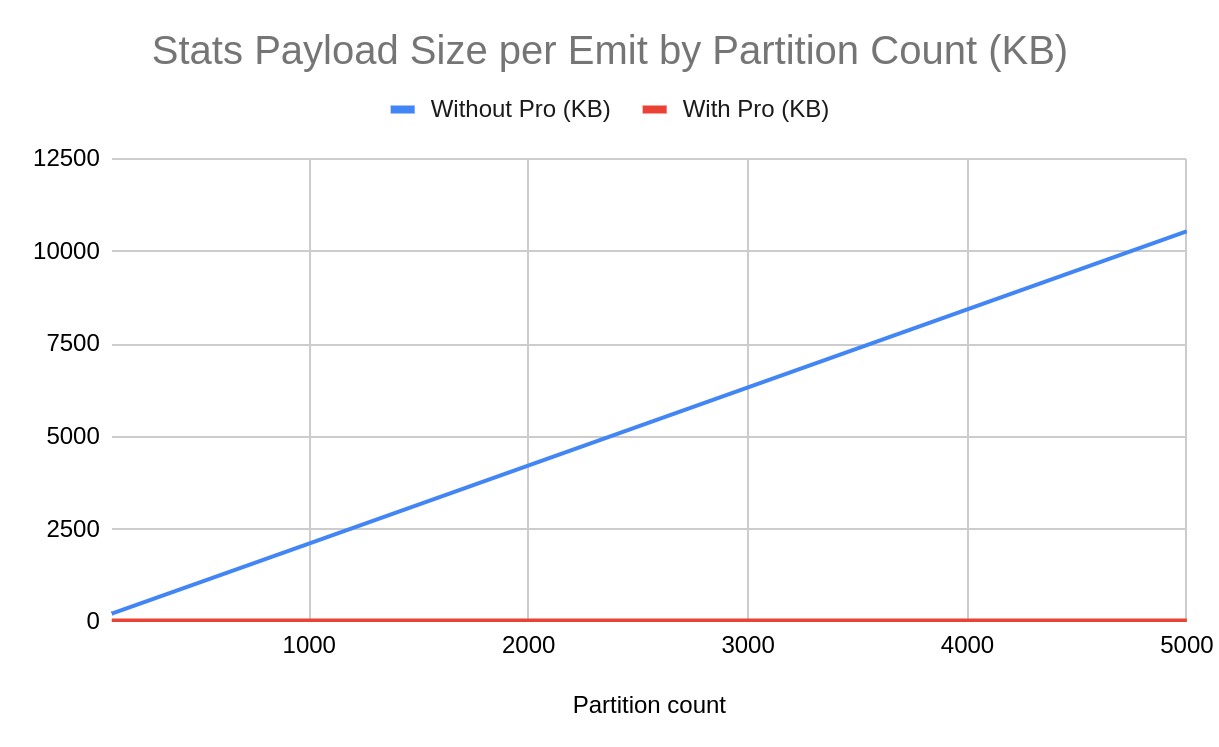
Without Pro, each stats emit grows linearly with partition count (~2.1 KB per partition). With Pro, payload stays constant at ~35 KB.
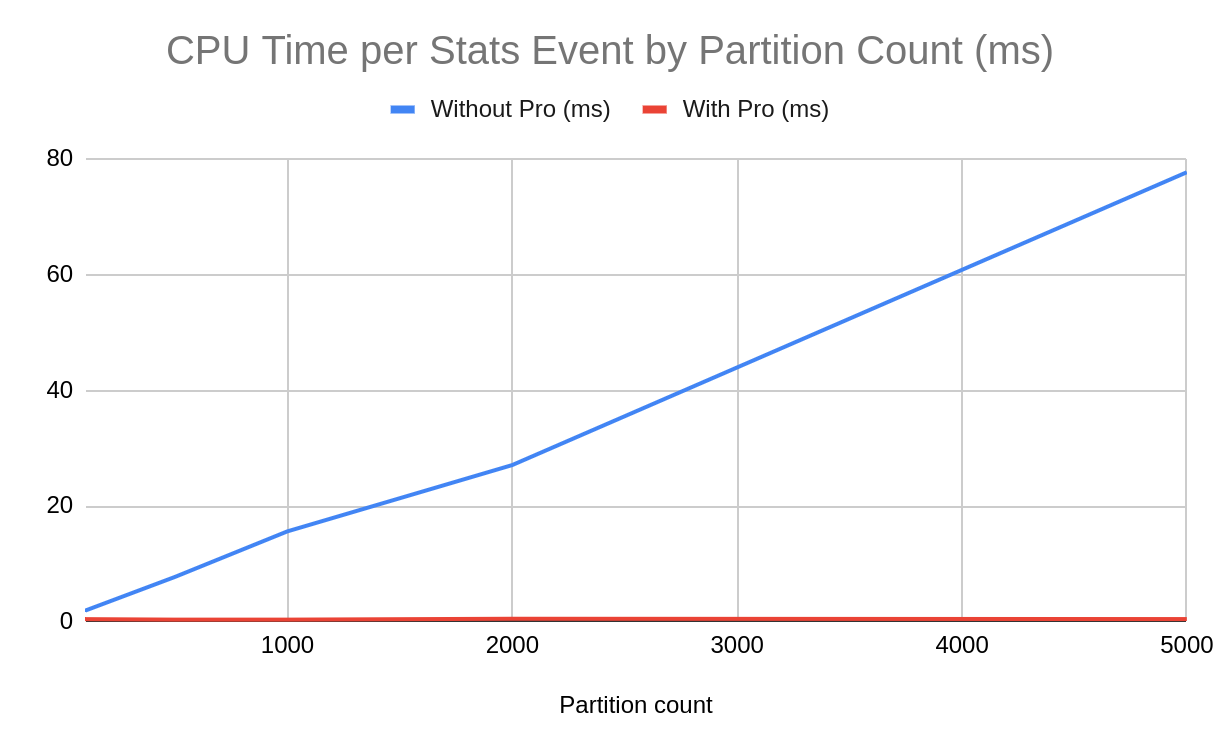
Decoration time scales from ~2 ms at 100 partitions to ~78 ms at 5,000 without Pro. With Pro, it remains flat at ~0.5 ms.
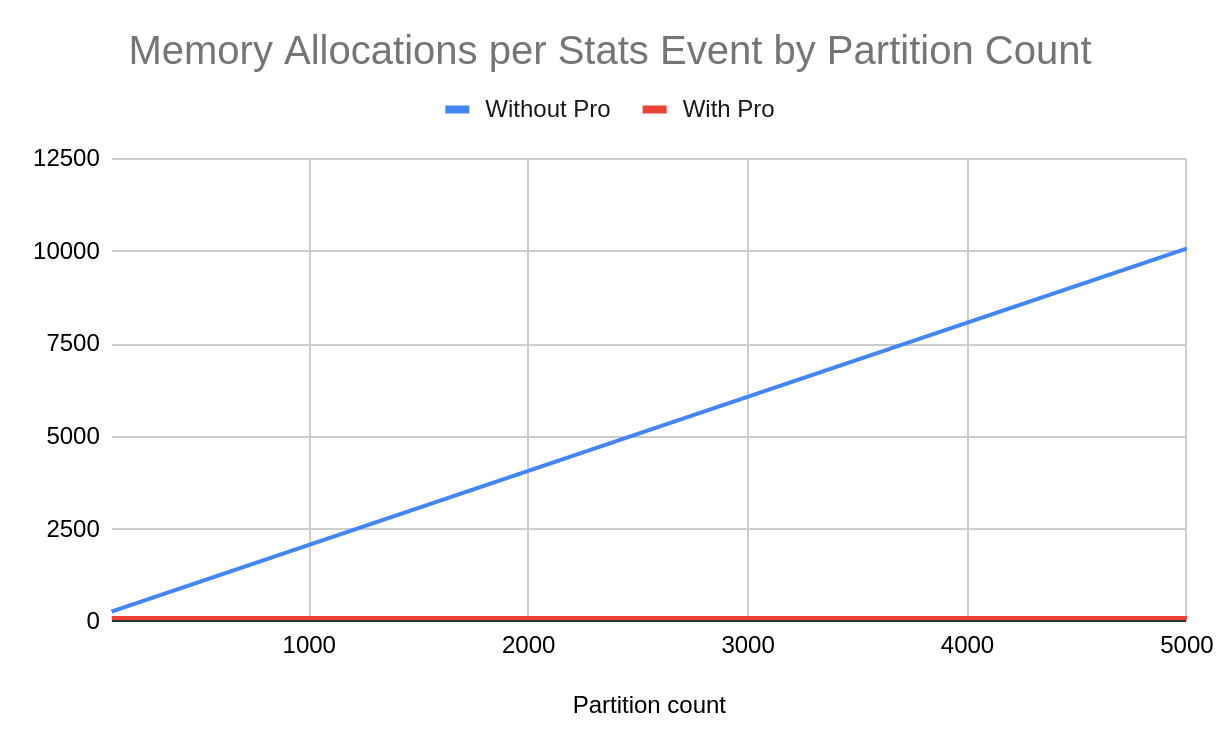
Object allocations per event grow at ~2 per partition without Pro. With Pro, allocations are constant at ~102 regardless of cluster size.
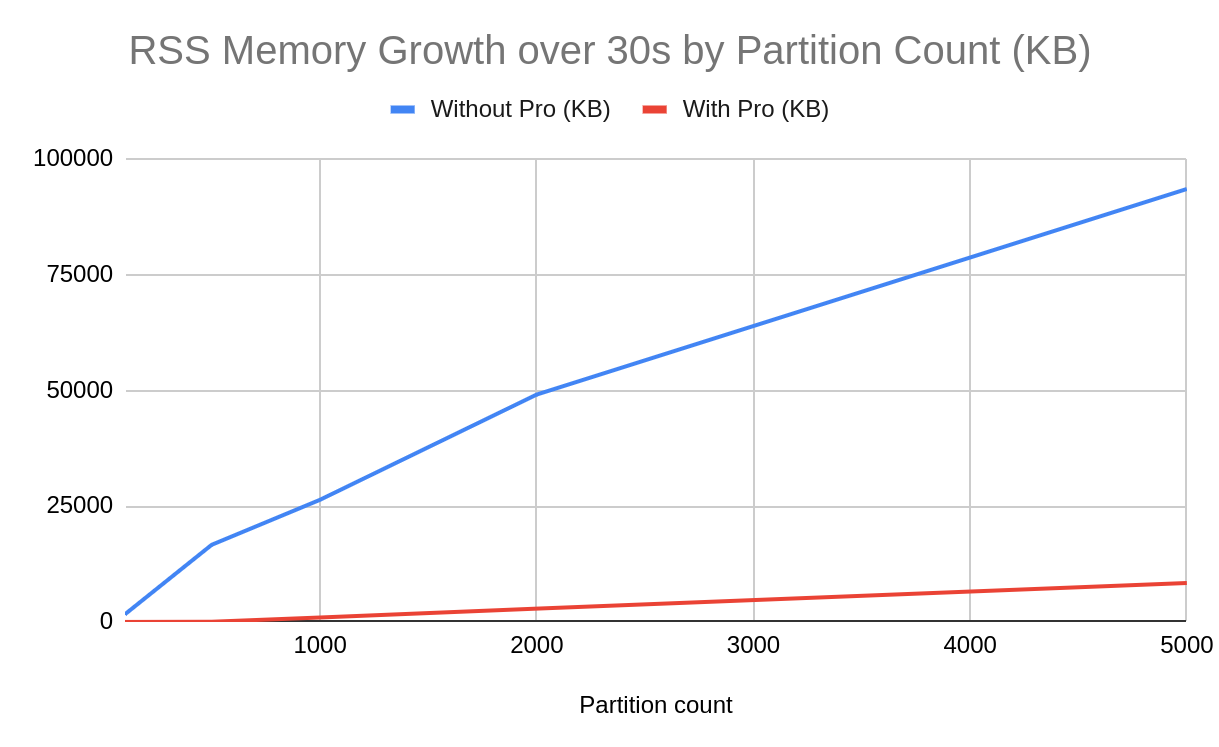
RSS memory growth over 30 seconds reaches ~91 MB at 5,000 partitions without Pro. With Pro, growth stays under ~9 MB.
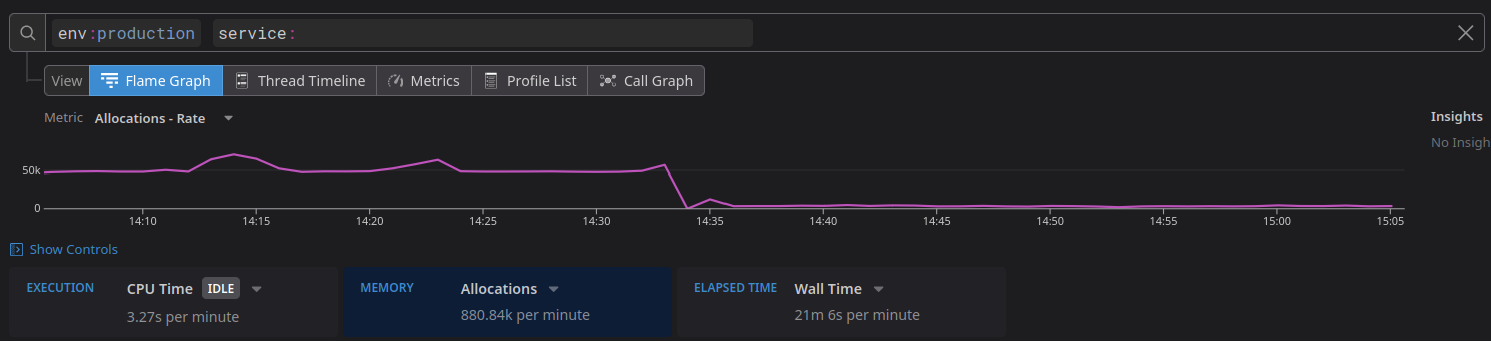
Allocations count drop observed after enabling Pro optimized statistics processing in a high-partition environment.
## Optimized Statistics Processing at Scale / Who Benefits
This optimization is most impactful for:
- Applications consuming from topics with **100+ partitions**
- Applications using **[Multiplexing](https://karafka.io/docs/Pro-Consumer-Groups-Multiplexing.md)**, where multiple consumer connections multiply the statistics overhead
- High-frequency statistics intervals used for real-time monitoring
- Applications relying on **[karafka-web](https://karafka.io/docs/Web-UI-Getting-Started.md)** metrics, which process statistics on every emit
The benefits scale with partition count - even at 100+ partitions, the reduced payload size and fewer allocations translate into measurable savings, especially when combined with Multiplexing or frequent statistics intervals.
## Optimized Statistics Processing at Scale / See Also
- [Librdkafka Statistics](https://karafka.io/docs/Librdkafka-Statistics.md) - Reference for all available statistics fields
- [Multiplexing](https://karafka.io/docs/Pro-Consumer-Groups-Multiplexing.md) - Multiple connections that compound statistics overhead without this optimization
- [Web UI](https://karafka.io/docs/Web-UI-Features.md) - Benefits from reduced statistics processing overhead
---
*Last modified: 2026-05-04 15:08:16*